The entrepreneurial system of the audiovisual supply chain
According to the latest available data from Istat, retrieved in the Statistic Business Archive for 2020, the film and television supply chain counts 7,555 companies. Although this was the year of the pandemic outbreak, the number of units had grown compared to 2019 by +2.4% (+1.1% on the total of non-agricultural businesses).
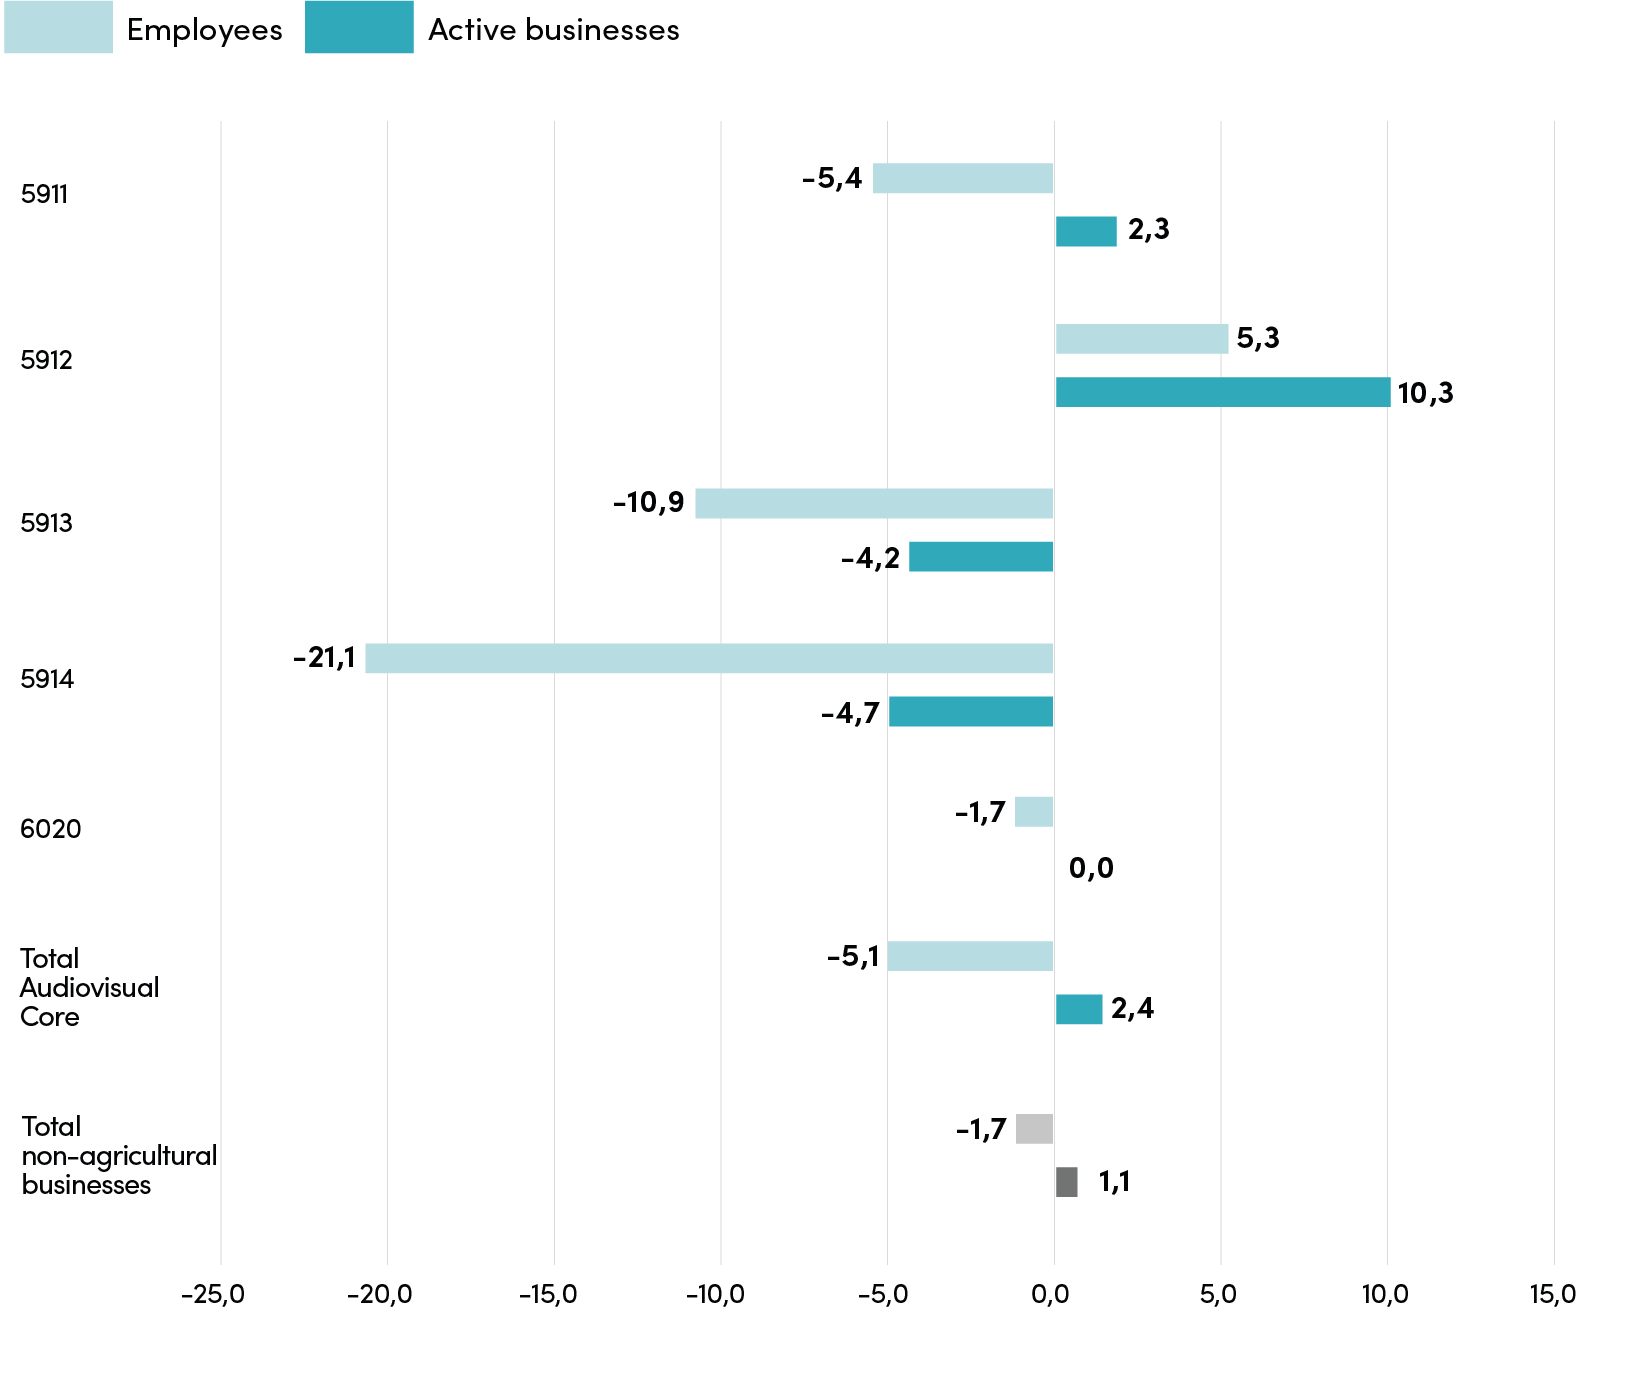
This result is largely due to the growth of Theatrical, video & TV post-production activities (+10.3%), which also recorded, in contrast to the rest of the supply chain, an increase in employment (+5 ,3%).
Beyond this exceptional data, the toll of the first year of the pandemic in the audiovisual sector was however substantial, with theatrical activities losing 4.7% of active businesses and goods and 21.1% of employees (the average overall loss being -5.1%).
Breakdown of active businesses and employees in the audiovisual supply chain* by production sectors
Year 2020 (absolute value)
| Sectors | Active Businesses | % | Employees | % | |
| 5911 | Theatrical, video & TV production activities | 4.641 | 61,4 | 15.299 | 33,0 |
| 5912 | Attività di post-produzione cinematografica, di video e di programmi tv | 1.270 | 16,8 | 2.618 | 5,6 |
| 5913 | Attività di distribuzione cinematografica, di video e di programmi tv* | 230 | 3,0 | 1.534 | 3,3 |
| 5914 | Attività di proiezione cinematografica | 684 | 9,1 | 4.523 | 9,7 |
| 6020 | Attività di programmazione e trasmissioni tv* | 730 | 9,7 | 22.420 | 48,3 |
| TOTAL AUDIOVISUAL | 7.555 | 100,0 | 46.395 | 100,0 |
* All data include Rai – Radiotelevisione italiana S.p.a. and Istituto Luce-Cinecittà for equal comparison, although they are classified as Public Offices and thus not included in the Business Register.
The business unit loss (-4.2%) within the theatrical, video & TV distribution activities also corresponds to significant losses in all employment sectors (-10.9%).
The dynamics of active businesses and employees in the audiovisual supply chain* by production sectors
Years 2020/2019 (percentage variation)
* All data include Rai – Radiotelevisione italiana S.p.a. and Istituto Luce-Cinecittà for equal comparison, although they are classified as Public Offices and thus not included in the Business Register.
The Theatrical, video & TV production data (+2.3% of companies, but -54% employment) are slightly less negative, and TV programming and broadcasting activities are healthier (businesses are stable, -1.7% employee variation).
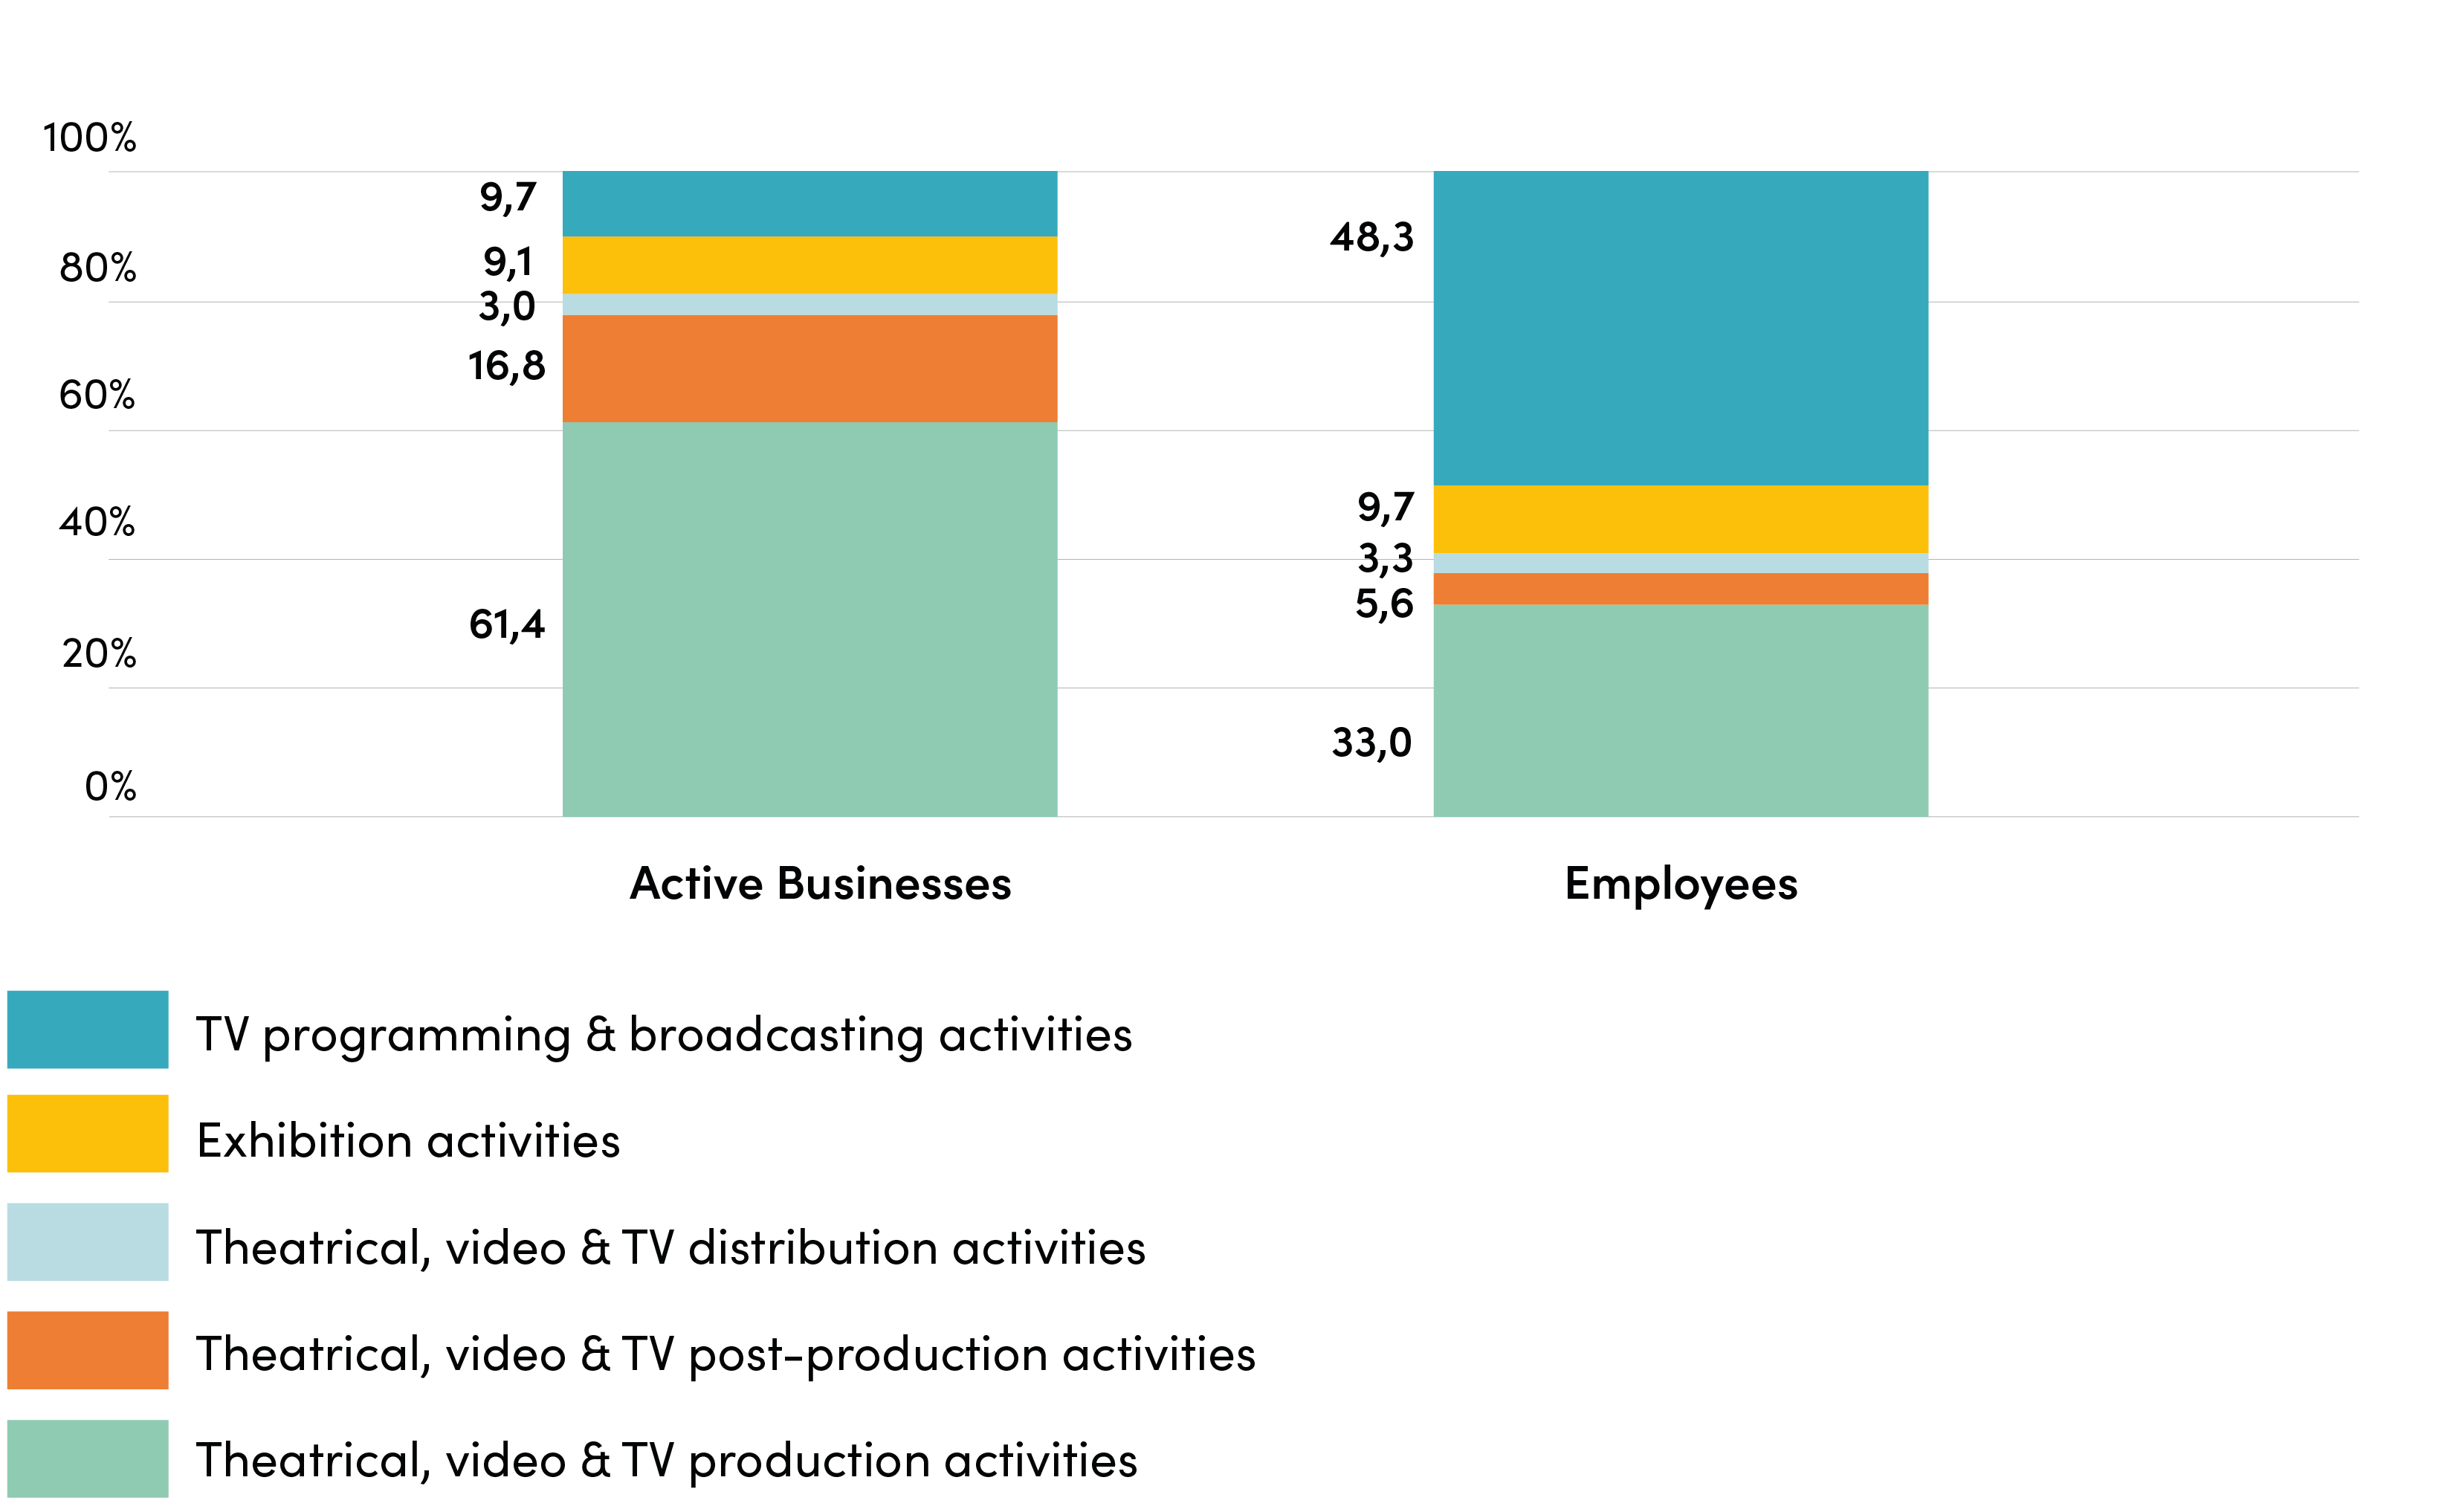
Looking into the sector’s activities, 61.4% of the companies operate in the Theatrical and/or television production field (4,641), while 1,270 are linked to post-production (which increases its weight compared to the pre-pandemic year, reaching 16.8%). Exhibition (down by 684 units) and TV programming (stable at 730) amount to 9.1% and 9.7% of the total, respectively, with Distribution activities representing 3.0 % with its 230 companies.
Distribution of active companies and employees in the audiovisual supply chain* by production sector
Year 2020 (by percentage)
* All data include Rai – Radiotelevisione italiana S.p.a. and Istituto Luce-Cinecittà for equal comparison, although they are classified as Public Offices and thus not included in the Business Register.
Moving on to the employees figures reported by the companies, 46,395 in total, the weight of Theatrical & TV production drops to 33.0%, post-production to 5.6%, while TV programming rises to 48.3% and Exhibition, given its sharp decrease, drops to 9.7%.
The data retrieved allows us to divide the businesses of the core perimeter into size classes: 93.5% of the supply chain is made up of micro-businesses (up to 9 employees), 5.5% are small (from 10 to 49 employees), 0.8% are medium (from 50 to 249 employees), and 0.2% are large or Majors (250 employees and more).
Breakdown of active companies in the audiovisual supply chain* by production sectors by employee class
Year 2020 (absolute value)
| Sectors | Up to 9 (micro) | 10-49 (small) | 50-249 (medium) | 250 and more (Majors) | Total | |
| 5911 | Theatrical, video & TV production activities | 4.430 | 166 | 39 | 6 | 4.641 |
| 5912 | Theatrical, video & TV post-production activities | 1.226 | 41 | 2 | 1 | 1.270 |
| 5913 | Theatrical, video & TV distribution activities* | 210 | 13 | 6 | 1 | 230 |
| 5914 | Exhibition activities | 605 | 70 | 7 | 2 | 684 |
| 6020 | TV programming & broadcasting activities* | 594 | 124 | 6 | 6 | 730 |
| TOTAL AUDIOVISUAL | 7.065 | 414 | 60 | 16 | 7.555 |
Percentage %
| Settori | fino a 9 (micro) | 10-49 (piccole) | 50-249 (medie) | 250 e oltre (grandi) | Totale | |
| 5911 | Theatrical, video & TV production activities | 95.5 | 3.6 | 0.8 | 0.1 | 100.0 |
| 5912 | Theatrical, video & TV post-production activities | 96.5 | 3.2 | 0.2 | 0.1 | 100.0 |
| 5913 | Theatrical, video & TV distribution activities* | 91.3 | 5.7 | 2.6 | 0.4 | 100.0 |
| 5914 | Exhibition activities | 88.5 | 10.2 | 1.0 | 0.3 | 100.0 |
| 6020 | TV programming & broadcasting activities* | 81.4 | 17.0 | 0.8 | 0.8 | 100.0 |
| TOTAL AUDIOVISUAL | 93.5 | 5.5 | 0.8 | 0.2 | 100.0 |
* All data include Rai – Radiotelevisione italiana S.p.a. and Istituto Luce-Cinecittà for equal comparison, although they are classified as Public Offices and thus not included in the Business Register.
The weight of micro-businesses is greater in post-production (96.5%), while the share of small businesses is higher in TV programming & broadcasting activities (17.0%), medium companies have a greater share in Theatrical, video & TV distribution activities (2.6%) and the large Majors are increasingly active in TV programming and broadcasting activities (0.8%).
The size classes can also be read based on the employees’ distribution. The incidence obviously changes significantly: 46.2% work in large companies, 24.2% in micro, 16.8% in small, and 12.9% in medium-sized companies.
Breakdown of audiovisual supply chain employees* by production sectors by employee classes
Year 2020 (absolute value)
| Sectors | Up to 9 (micro) | 10-49 (small) | 50-249 (medium) | 250 and more (Majors) | Total | |
| 5911 | Theatrical, video & TV production activities | 6.036 | 3.143 | 4.262 | 1.858 | 15.299 |
| 5912 | Theatrical, video & TV post-production activities | 1.682 | 739 | 147 | 50 | 2.618 |
| 5913 | Theatrical, video & TV distribution activities* | 408 | 268 | 590 | 268 | 1.534 |
| 5914 | Exhibition activities | 1.900 | 1.120 | 496 | 1.007 | 4.523 |
| 6020 | TV programming & broadcasting activities* | 1.179 | 2.508 | 481 | 18.253 | 22.420 |
| TOTAL AUDIOVISUAL | 11.205 | 7.778 | 5.976 | 21.436 | 46.395 |
Composition %
| Settori | fino a 9 (micro) | 10-49 (piccole) | 50-249 (medie) | 250 e oltre (grandi) | Totale | |
| 5911 | Theatrical, video & TV production activities | 39.5 | 20.5 | 27.9 | 12.1 | 100.0 |
| 5912 | Theatrical, video & TV post-production activities | 64.3 | 28.2 | 5.6 | 1.9 | 100.0 |
| 5913 | Theatrical, video & TV distribution activities* | 26.6 | 17.5 | 38.5 | 17.5 | 100.0 |
| 5914 | Exhibition activities | 42.0 | 248 | 11.0 | 22.3 | 100.0 |
| 6020 | TV programming & broadcasting activities* | 5.3 | 11.2 | 2.1 | 81.4 | 100.0 |
| TOTAL AUDIOVISUAL | 24.2 | 16.8 | 12.9 | 46.2 | 100.0 |
* All data include Rai – Radiotelevisione italiana S.p.a. and Istituto Luce-Cinecittà for equal comparison, although they are classified as Public Offices and thus not included in the Business Register.
Looking into the different sectors, in Post-production, 64.3% of regular employees are in micro-enterprises. Employment is also high in the average small businesses (28.2%). In Theatrical, video & TV distribution activities, 38.5% of employees are in medium-sized companies, while in TV programming and broadcasting, Majors are predominant (81.4%).