Women employees
On the basis of Istat data referring to the Statistic Archive of Active Companies (Year 2020), the breakdown by gender of the data relating to women employees operating in the audiovisual businesses supply chain can be acquired.
Their presence is, on average, slightly higher than the overall data (42.7% compared to 40.2%), with a peak in the Theatrical, video & TV distribution sector, where the presence of women well exceeds half of the total (56.9%).
The lowest figure for female employees concerns the Theatrical, video & TV post-production activities (39.1%), while Theatrical, video & TV production, and television programming and broadcasting are on average (41.3% and 42%), and Exhibition activities are definitely higher (48.2%).
Women and men employees of the audiovisual core by production sectors
Year 2020 (percentage)
| Sectors | Percentage % | |||
| Women | Men | Total | ||
| 5911 | Theatrical, video & TV production activities | 41,3 | 58,7 | 100,0 |
| 5912 | Theatrical, video & TV post-production activities | 39,1 | 60,9 | 100,0 |
| 5913 | Theatrical, video & TV distribution activities* | 56,9 | 43,1 | 100,0 |
| 5914 | Exhibition activities | 48,2 | 51,8 | 100,0 |
| 6020 | TV programming & broadcasting activities* | 42,0 | 58,0 | 100,0 |
| TOTAL AUDIOVISUAL CORE | 42,7 | 57,3 | 100,0 | |
| TOTAL ECONOMY | 40,2 | 59,6 | 100,0 |
* All data include Rai – Radiotelevisione italiana S.p.a. and Istituto Luce-Cinecittà for equal comparison, although they are classified as Public Offices and thus not included in the Business Register.
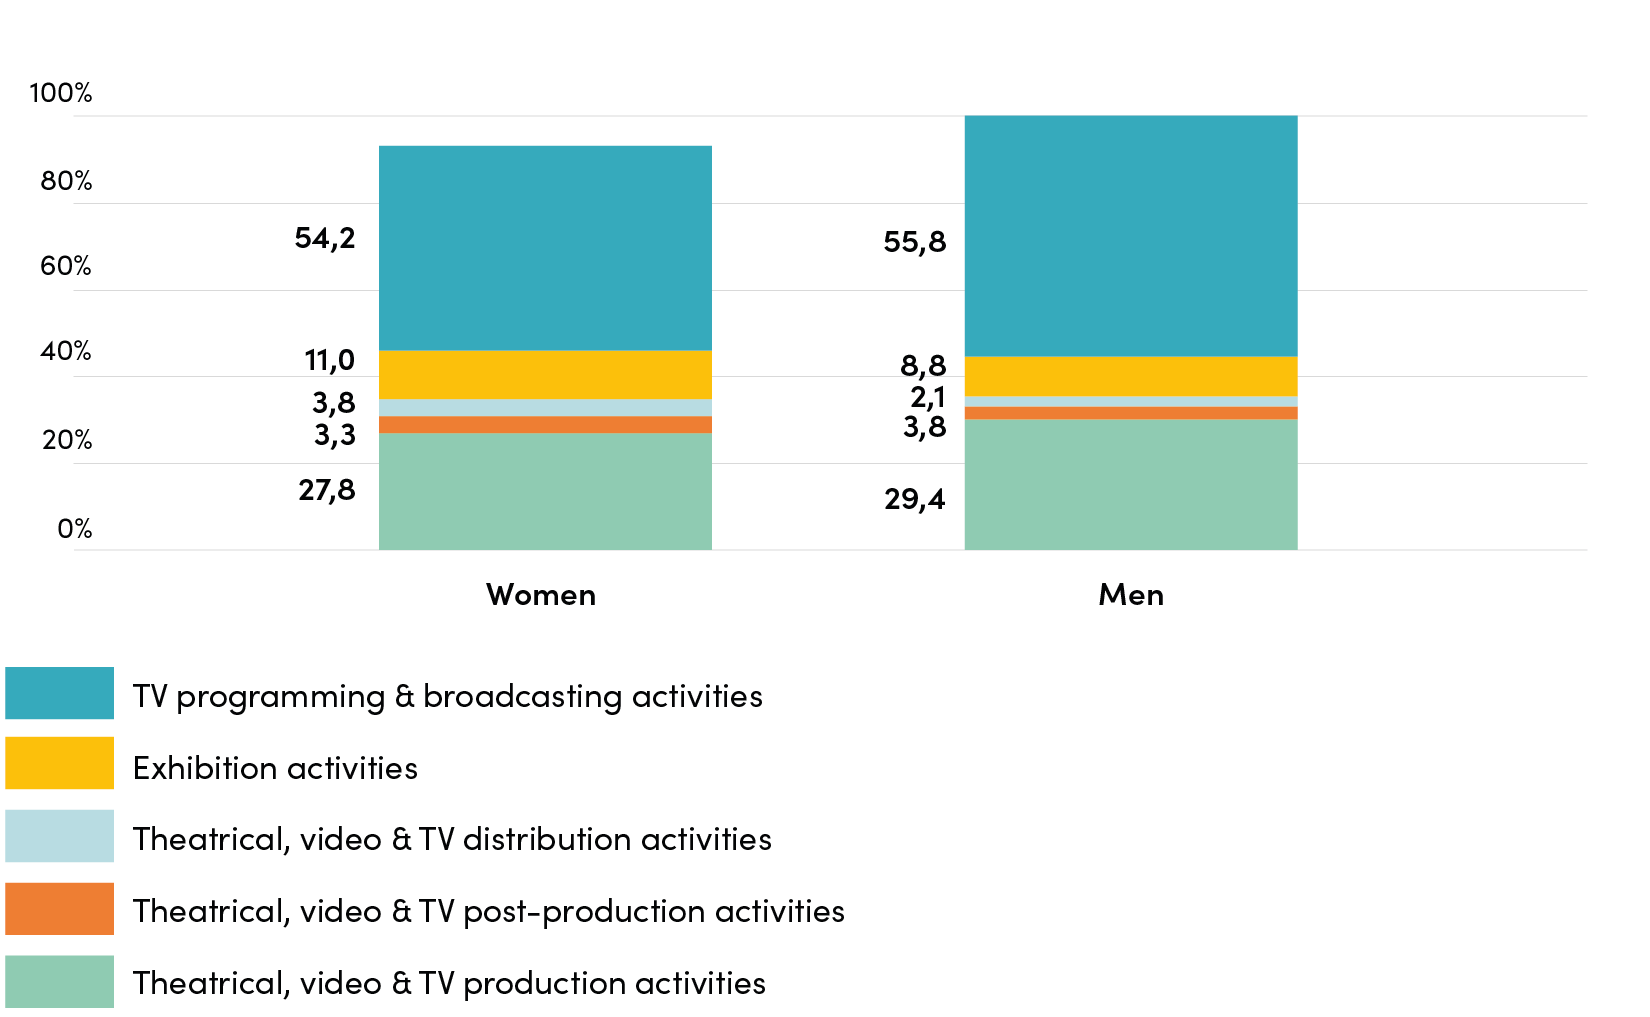
Observing the employee distribution within the different sectors, the concentration of women employees appears slightly higher in Exhibition activities (11.0% of female employees versus 8.8% of male employees) and in Theatrical, video & TV distribution activities (3.8% versus 2.1%).
The absolute presence of women employees is slightly lower within the Theatrical, video & TV production activities, with 27.8% of women vs. 29.4% of men, and to a limited extent within the TV programming & broadcasting activities (54.2% vs. 55.8%).
Distribution of women and men employed in the audiovisual supply chain by production sector
Year 2020 (percentage)
* All data include Rai – Radiotelevisione italiana S.p.a. and Istituto Luce-Cinecittà for equal comparison, although they are classified as Public Offices and thus not included in the Business Register.