The 2023-2024 Business Register Entry/Exit Rates
The dynamics of business entries and terminations (so-called “ex officio exits”) show a ratio of start-ups to closures favoring the latter, with a constant ratio from 2022 onward of approximately 0.8 companies born for each company ceased.
Relationship between entries and ex-officio exits in the audiovisual supply chain
Years 2021-2024 (companies born for each company ceased)
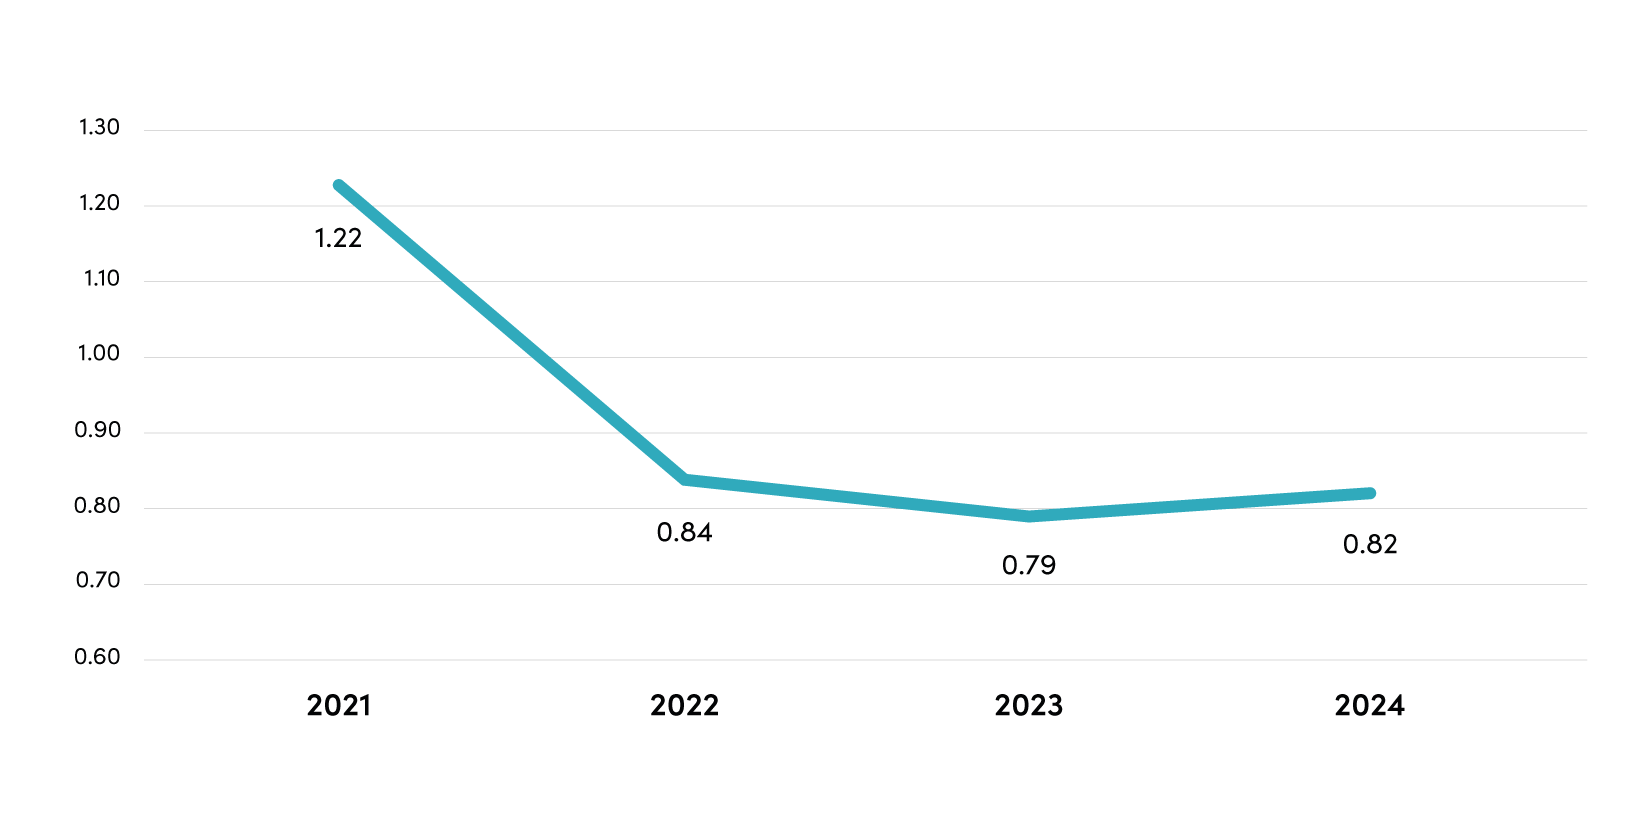
Source: Symbola Foundation elaboration on Infocamere data
Regarding business registrations1, in 2023, there were 351 new businesses in the audiovisual supply chain sector, a figure 16 units higher than that of 2022, with a relative ratio better than that of all companies (+4.6% compared to +3.3%).
1 Registration at the Chamber of Commerce Business Register is a mandatory “one-off” administrative procedure defined at the start of a company. It consists of two phases: the first, where a digitally signed application is submitted electronically within 30 days of the activity’s start; the second, where the application is verified and proceeds to registration.
Entries and ex-officio exits in the audiovisual supply chain
Years 2021-2024 (absolute values)
REGISTRATIONS
| Ateco | Description Ateco | 2021 | 2022 | 2023 | 2024 | Diff. 24/23 |
| 5911 | Theatrical, video & TV production activities | 293 | 238 | 252 | 245 | -7 |
| 5912 | Theatrical, video & TV post-production activities | 60 | 81 | 68 | 81 | 13 |
| 5913 | Theatrical, video & TV distribution activities | 3 | 5 | 7 | 3 | -4 |
| 5914 | Exhibition activities | 14 | 4 | 4 | 10 | 6 |
| 6020 | TV programming & broadcasting activities | 12 | 4 | 4 | 12 | 8 |
| TOTAL AUDIOVISUAL CORES | 382 | 332 | 335 | 351 | 16 | |
| TOTAL COMPANIES | 332,596 | 312,564 | 312,050 | 322,835 | 10,785 |
EX OFFICIO TERMINATIONS
| Ateco | Description Ateco | 2021 | 2022 | 2023 | 2024 | Diff. 24/23 |
| 5911 | Theatrical, video & TV production activities | 246 | 276 | 320 | 312 | -8 |
| 5912 | Theatrical, video & TV post-production activities | 23 | 52 | 43 | 47 | 4 |
| 5913 | Theatrical, video & TV distribution activities | 6 | 10 | 14 | 13 | -1 |
| 5914 | Exhibition activities | 27 | 36 | 27 | 30 | 3 |
| 6020 | TV programming & broadcasting activities | 10 | 20 | 19 | 26 | 7 |
| TOTAL AUDIOVISUAL CORES | 312 | 394 | 423 | 428 | 5 | |
| TOTAL COMPANIES | 246,009 | 264,546 | 270,011 | 285,979 | 15,968 |
Source: Symbola Foundation elaboration on Infocamere data
In 2024, the ex-officio exits2 were 428, in line with 2023 (5 more), and a much lower proportion than for the overall economic activities (+1.2% compared to +5.6%).
The sector with the best results in terms of entry/exits is that of theatrical, video & TV post-production, where the 47 terminations in 2024 are contrasted with 81 new entries (1.72 ratio). In the other cases, the entry ratio is always negative: 0.79 in theatrical, video & TV production; 0.46 in TV programming and broadcasting; 0.33 in film screening; and 0.23 in theatrical, video & TV distribution.
2 Ex-officio exits are “effective” terminations, i.e., not due to a purely administrative cancellation (linked to the cleaning of archives by the Chambers of Commerce).
Ratio between registrations and ex-officio exits in the audiovisual supply chain by sectors
Year 2024 (entries/exits)
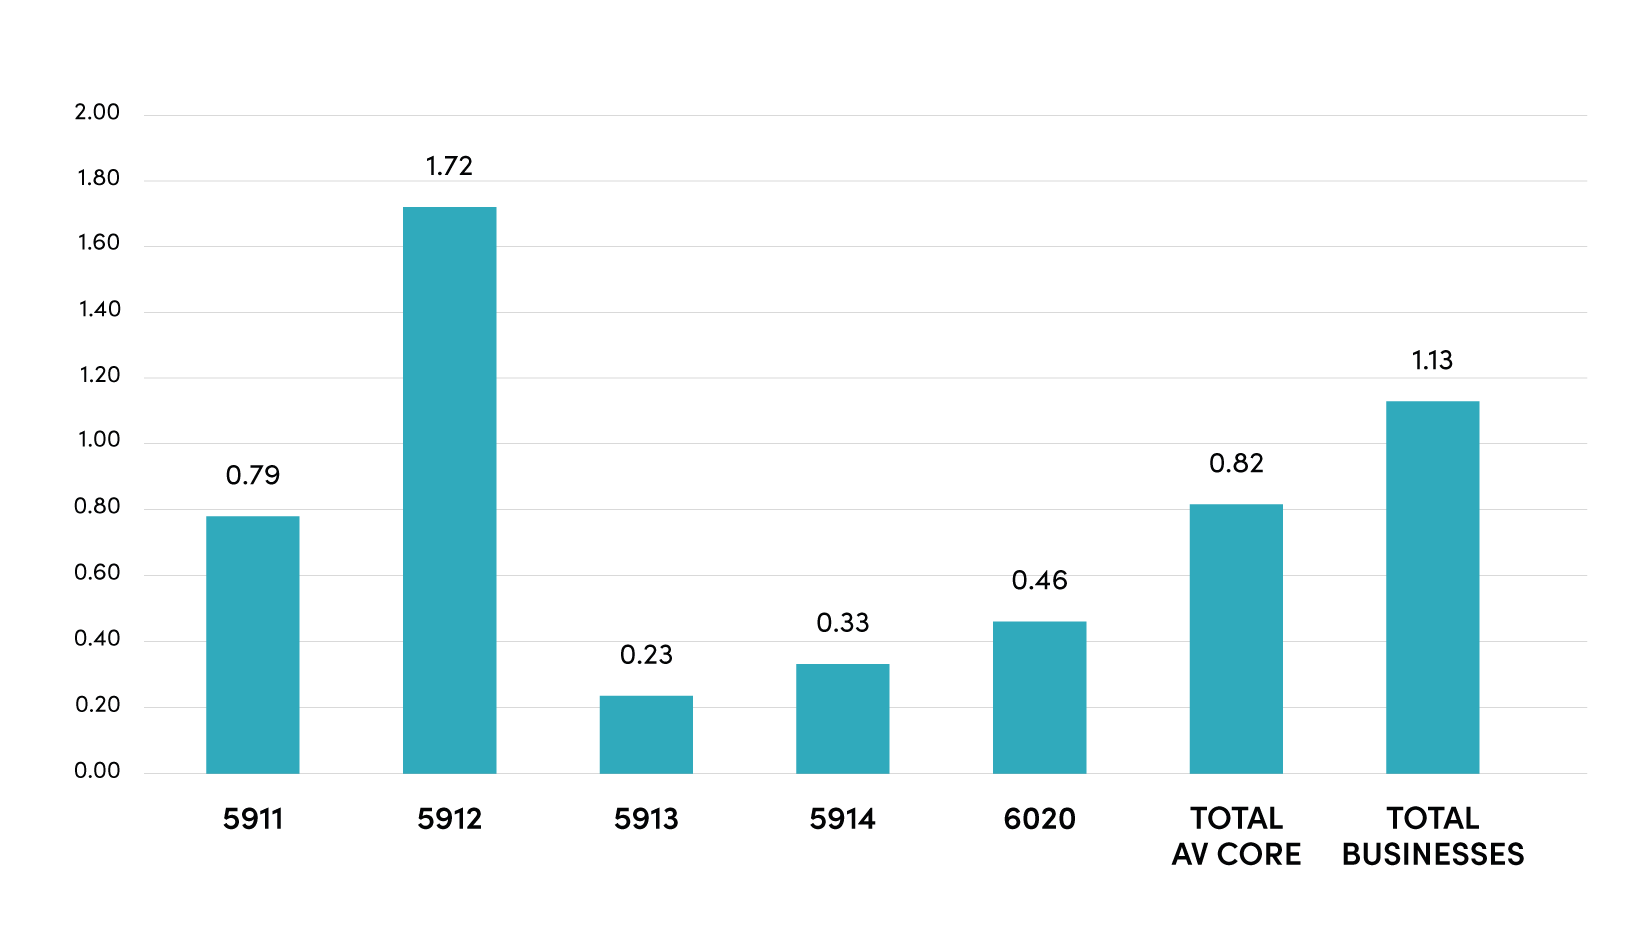
Source: Symbola Foundation elaboration on Infocamere data
In 2024, registrations of post-production, TV programming & broadcasting, and exhibition businesses increased compared to 2023, while registrations in production and distribution decreased.
The increase in business terminations primarily affected TV programming & broadcasting activities, as well as post-production and exhibition activities, whereas terminations decreased for theatrical, video & TV production and distribution.
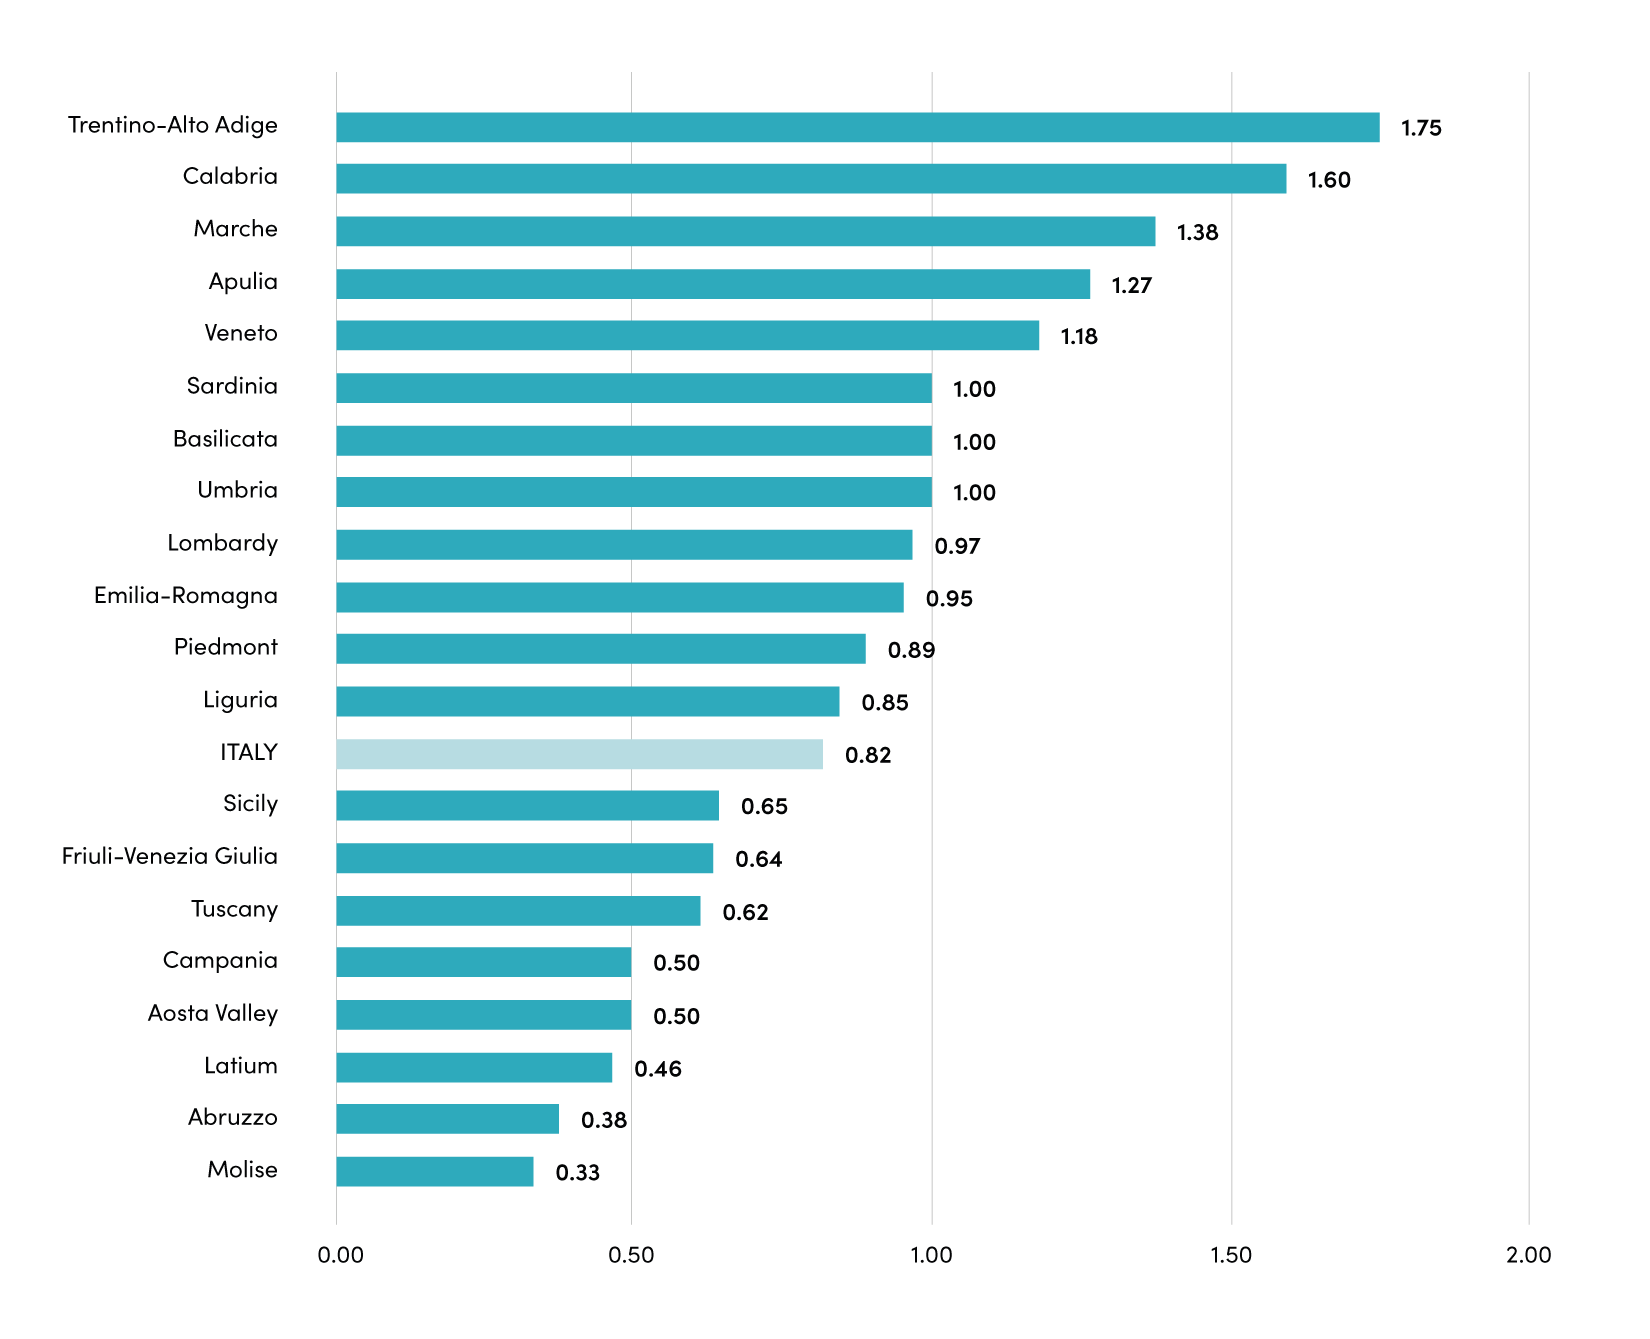
Among the Italian regions, the following stand out for their registration ratios exceeding terminations: Trentino-Alto Adige (+1.75), Calabria (+1.60), Marche (+1.38), Apulia (+1.27), and Veneto (+1.18).
Sardinia, Basilicata, and Umbria recorded an equal number of new business registrations and closures. In contrast, the regions with the most significant decline—where closures far outnumbered new companies (well below the national rate of 0.82)—were Campania and Valle d’Aosta (both at 0.5), Lazio (0.46), Abruzzo (0.38), and Molise (0.33).
In absolute terms, entries have increased significantly in Lombardy (+17.0: 94 in 2024 and 77 in 2023), in Trentino-Alto Adige (+16.0, with an extremely positive assessment: 28 in 2024 compared to 12 in 2023), and in Veneto (+7.0: 26 in 2024 compared to 12 in 2023). The results for Lazio
(-14.0: 46 in 2024 compared to 60 in 2023) and Tuscany (-8.0: 16 in 2024 compared to 24 in 2023) are negative.
Business terminations have increased significantly in Lombardy (+12.0: 97 in 2024 compared to 85 in 2023), while they have decreased significantly in Apulia (-14.0: 15 in 2024 compared to 29 in 2023) and Lazio (-8.0: 99 in 2024 compared to 107 in 2023).
Ratio between registrations and ex officio exits in the audiovisual supply chain by region
Years 2024 (entry/exits)
Source: Symbola Foundation elaboration on Infocamere data
Business registrations in the audiovisual supply chain in Italian regions
Years 2021-2024 (absolute values)
| Regions | 2021 | 2022 | 2023 | 2024 | Diff. 24/23 |
| Piedmont | 22 | 32 | 29 | 24 | -5 |
| Aosta Valley | 1 | 0 | 3 | 1 | -2 |
| Lombardy | 82 | 78 | 77 | 94 | 17 |
| Trentino-Alto Adige | 18 | 10 | 12 | 28 | 16 |
| Friuli-Venezia Giulia | 7 | 12 | 5 | 7 | 2 |
| Veneto | 27 | 25 | 19 | 26 | 7 |
| Liguria | 8 | 4 | 6 | 11 | 5 |
| Emilia-Romagna | 29 | 27 | 21 | 21 | 0 |
| Tuscany | 14 | 21 | 24 | 16 | -8 |
| Umbria | 3 | 3 | 6 | 3 | -3 |
| Marche | 10 | 11 | 9 | 11 | 2 |
| Latium | 62 | 48 | 60 | 46 | -14 |
| Abruzzo | 8 | 7 | 6 | 3 | -3 |
| Molise | 0 | 1 | 1 | 1 | 0 |
| Campania | 42 | 18 | 16 | 13 | -3 |
| Apulia | 20 | 10 | 12 | 19 | 7 |
| Basilicata | 1 | 1 | 2 | 1 | -1 |
| Calabria | 7 | 9 | 8 | 8 | 0 |
| Sicily | 17 | 8 | 11 | 11 | 0 |
| Sardinia | 4 | 7 | 8 | 7 | -1 |
| ITALY | 382 | 332 | 335 | 351 | 16 |
Source: Symbola Foundation elaboration on Infocamere data
Business terminations in the audiovisual sector in Italian regions
Years 2021-2024 (absolute values)
| Regions | 2021 | 2022 | 2023 | 2024 | Diff. 24/23 |
| Piedmont | 16 | 24 | 26 | 27 | 1 |
| Aosta Valley | 1 | 2 | 2 | 2 | 0 |
| Lombardy | 60 | 82 | 85 | 97 | 12 |
| Trentino-Alto Adige | 12 | 10 | 14 | 16 | 2 |
| Friuli-Venezia Giulia | 4 | 4 | 9 | 11 | 2 |
| Veneto | 18 | 29 | 22 | 22 | 0 |
| Liguria | 3 | 8 | 8 | 13 | 5 |
| Emilia-Romagna | 18 | 26 | 20 | 22 | 2 |
| Tuscany | 24 | 29 | 21 | 26 | 5 |
| Umbria | 6 | 3 | 4 | 3 | -1 |
| Marche | 4 | 12 | 7 | 8 | 1 |
| Latium | 81 | 86 | 107 | 99 | -8 |
| Abruzzo | 4 | 13 | 4 | 8 | 4 |
| Molise | 2 | 0 | 1 | 3 | 2 |
| Campania | 21 | 20 | 31 | 26 | -5 |
| Apulia | 16 | 14 | 29 | 15 | -14 |
| Basilicata | 1 | 1 | 4 | 1 | -3 |
| Calabria | 6 | 6 | 5 | 5 | 0 |
| Sicily | 10 | 21 | 20 | 17 | -3 |
| Sardinia | 5 | 4 | 4 | 7 | 3 |
| ITALY | 312 | 394 | 423 | 428 | 5 |
Source: Symbola Foundation elaboration on Infocamere data