Women employees and professionals
Updated data on women employment in the audiovisual supply chain can be found within the INPS databank for former ENPALS employees according to the ATECO classification hereby adopted. In line with this data, the share of women in 2021 is slightly lower compared with that of the non-agricultural industrial market (41.6% against 42.3%).
Women employment within the audiovisual industry vs. the overall industrial (non-agricultural) market
Year 2021 (in percentage)
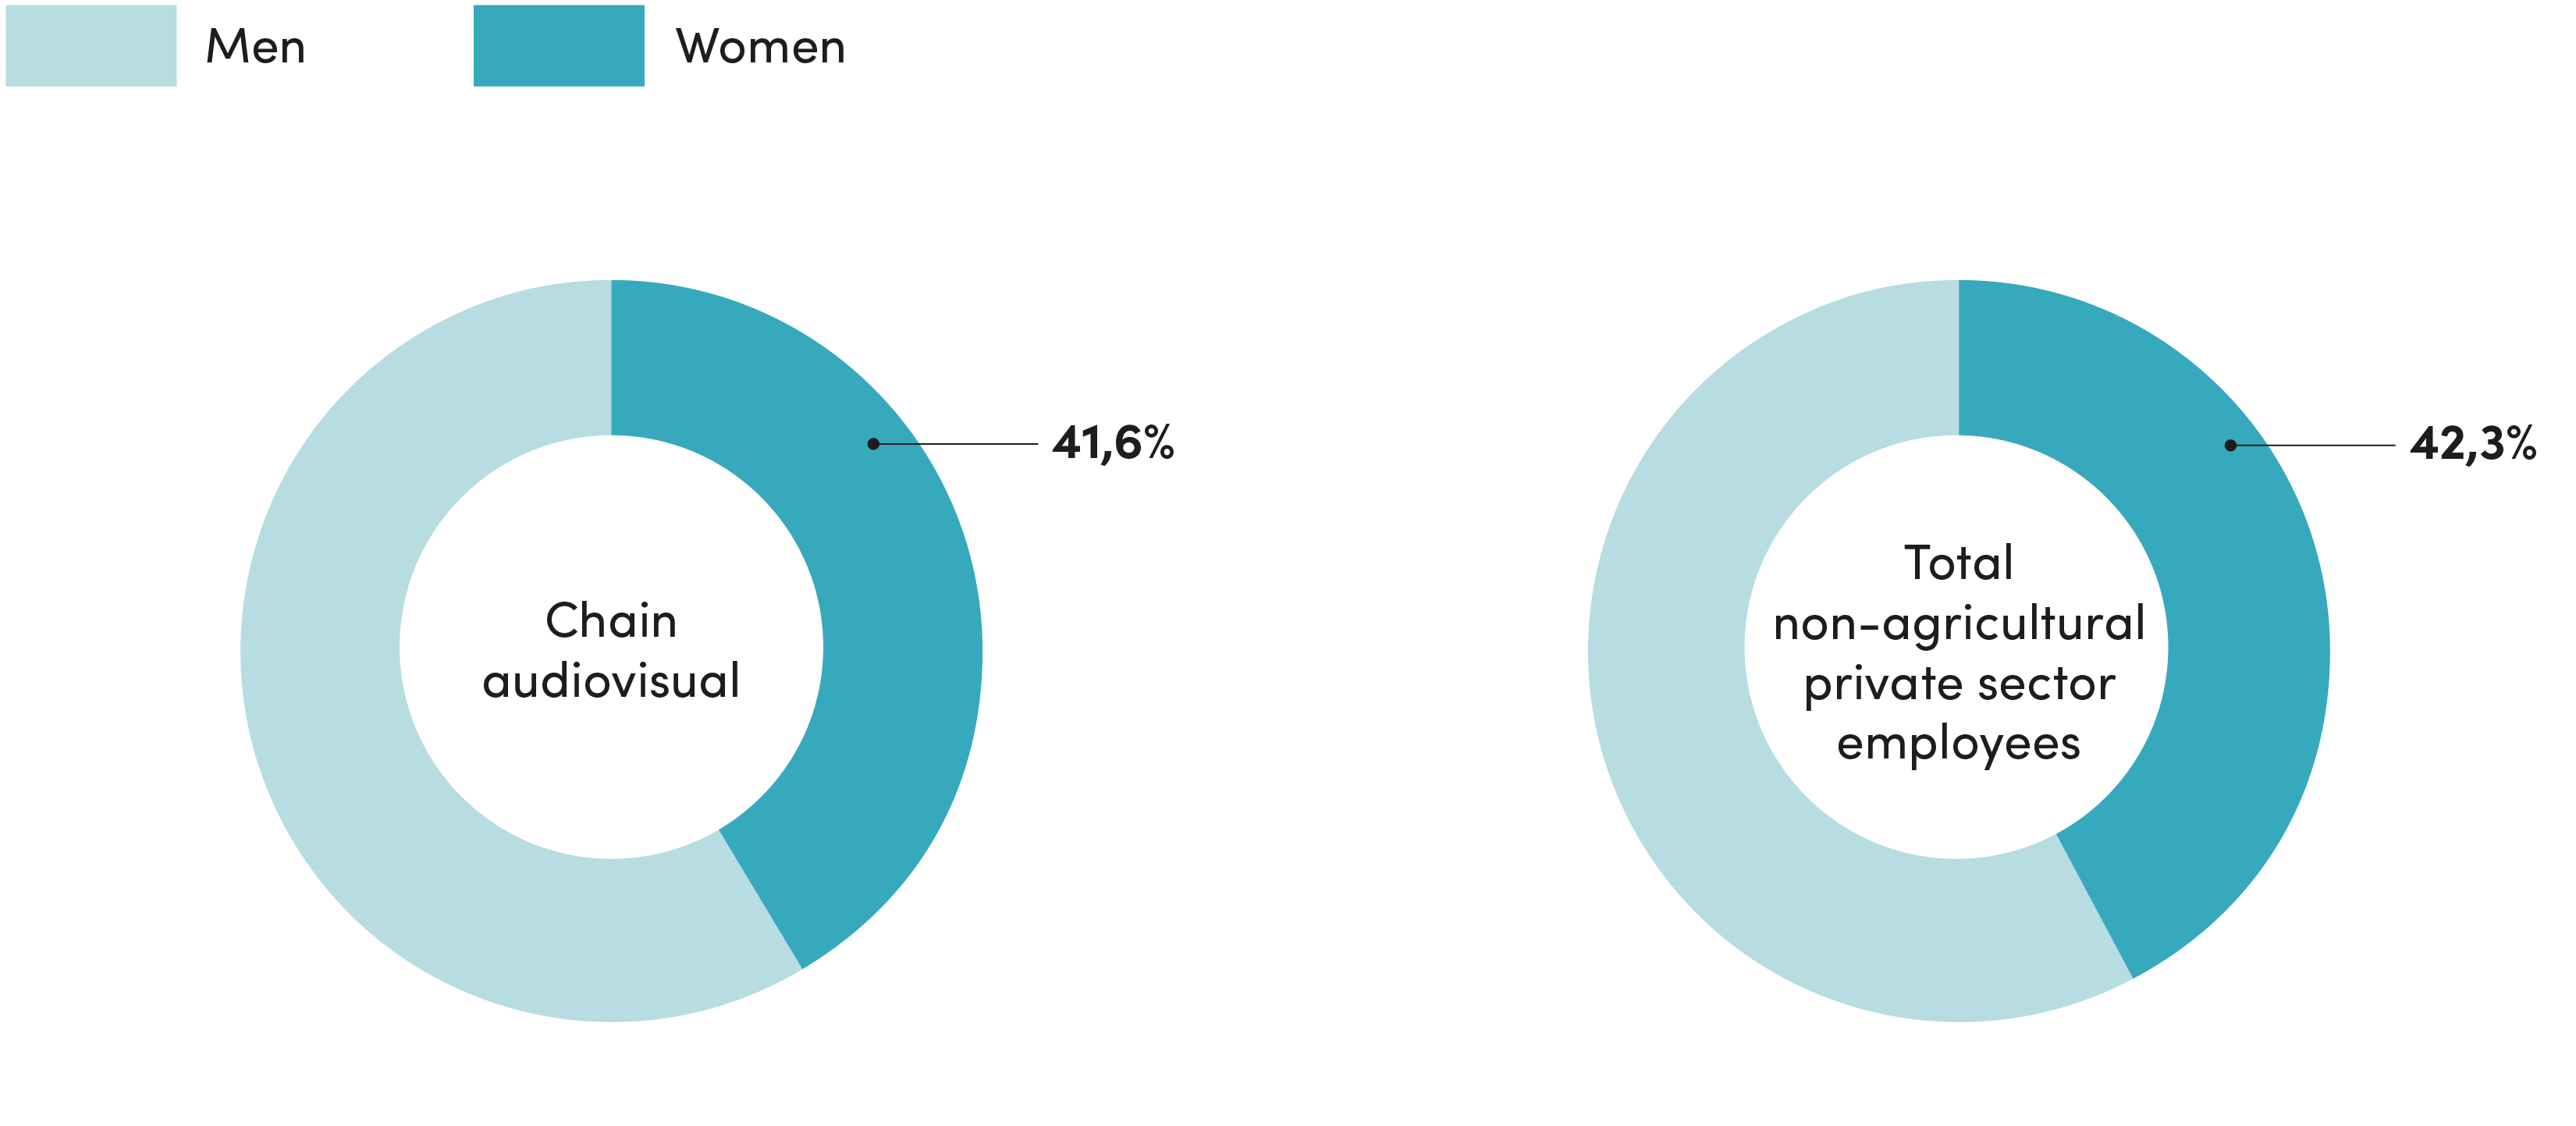
Source: Symbola Foundation elaborations based on INPS data
These data allow further analysis of women’s employment in the audiovisual sector. Exhibition activities (45.1%) and even more distribution activities – where women overtake men, albeit slightly (51.1%) – stand out for the presence of employed women above the audiovisual and overall (non-agricultural) industrial averages.
Breakdown of former ENPALS female employees within the audiovisual core by activity sectors
Year 2021 (in percentage)
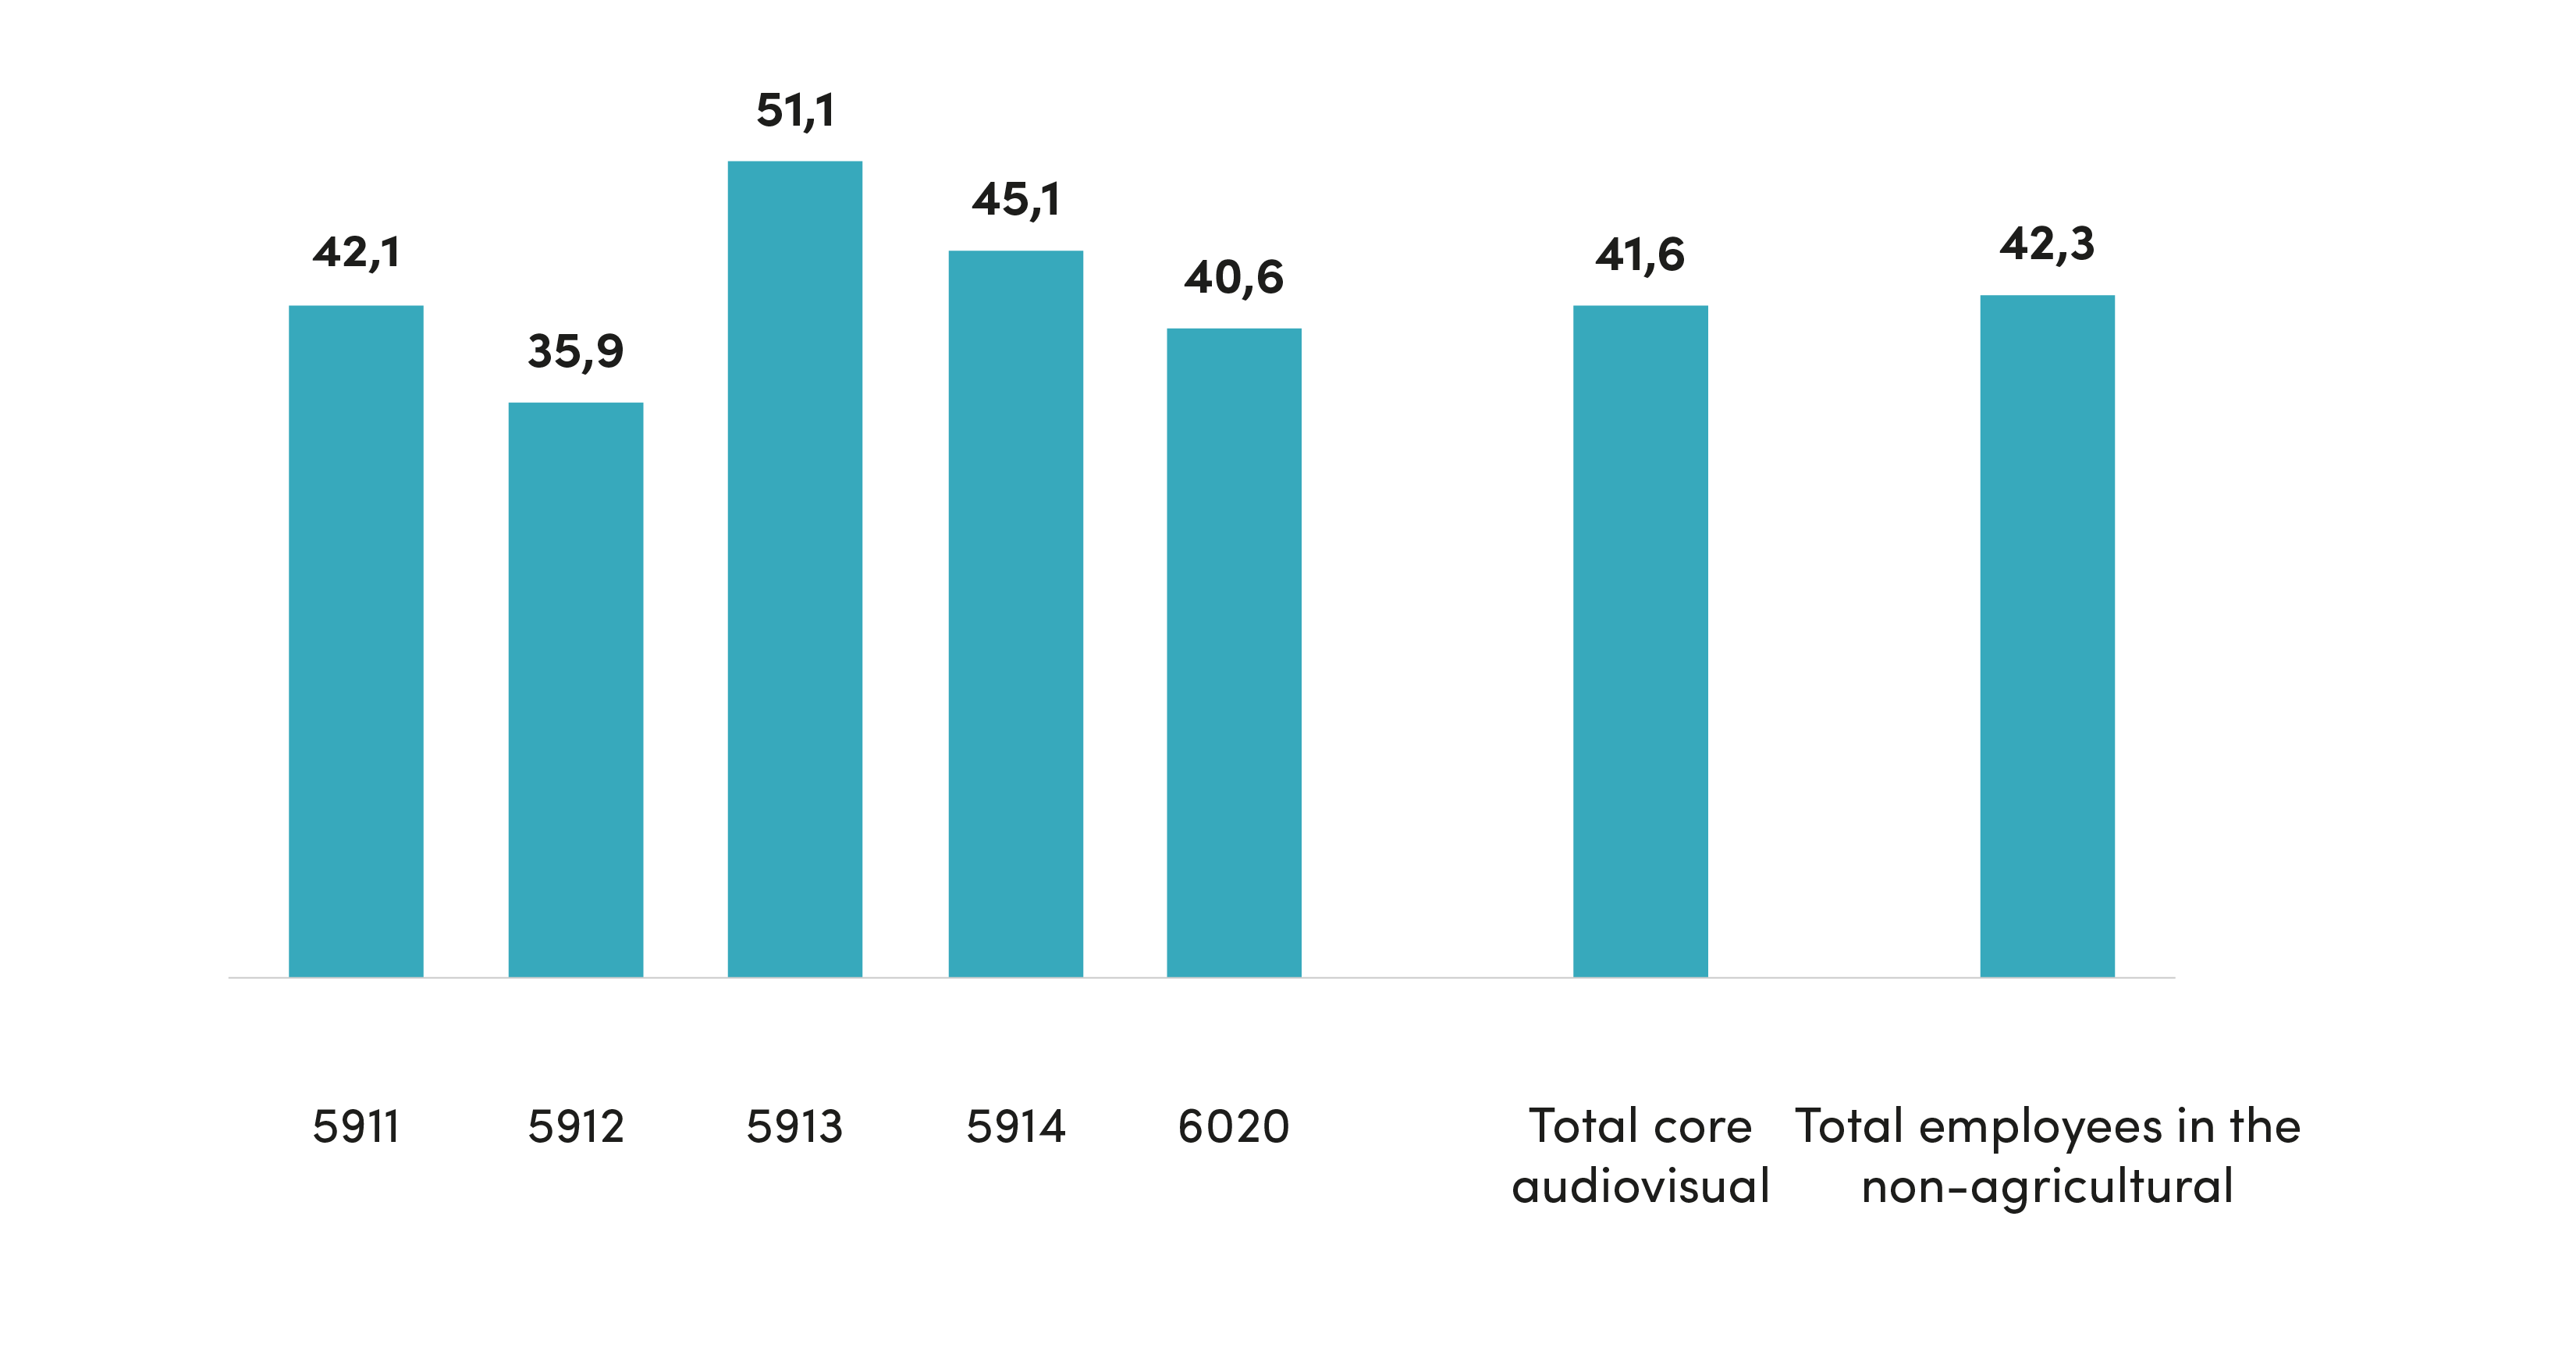
Source: Symbola Foundation elaborations based on INPS data
The female component of former ENPALS workers in the audiovisual sector is, on average, younger, with a 29.5% share of workers up to 29 years of age, which, in the case of men, drops to 22.8%. This figure is particularly etched by the production sector, where the share of women under 30 is 46.8%.
On the other hand, the presence of women over 50 in the audiovisual chain corresponds to 29.5%, while the equivalent value for men is 34.9%.
Breakdown of former ENPALS female employees within the audiovisual core by activity sectors
Year 2021 (in percentage)
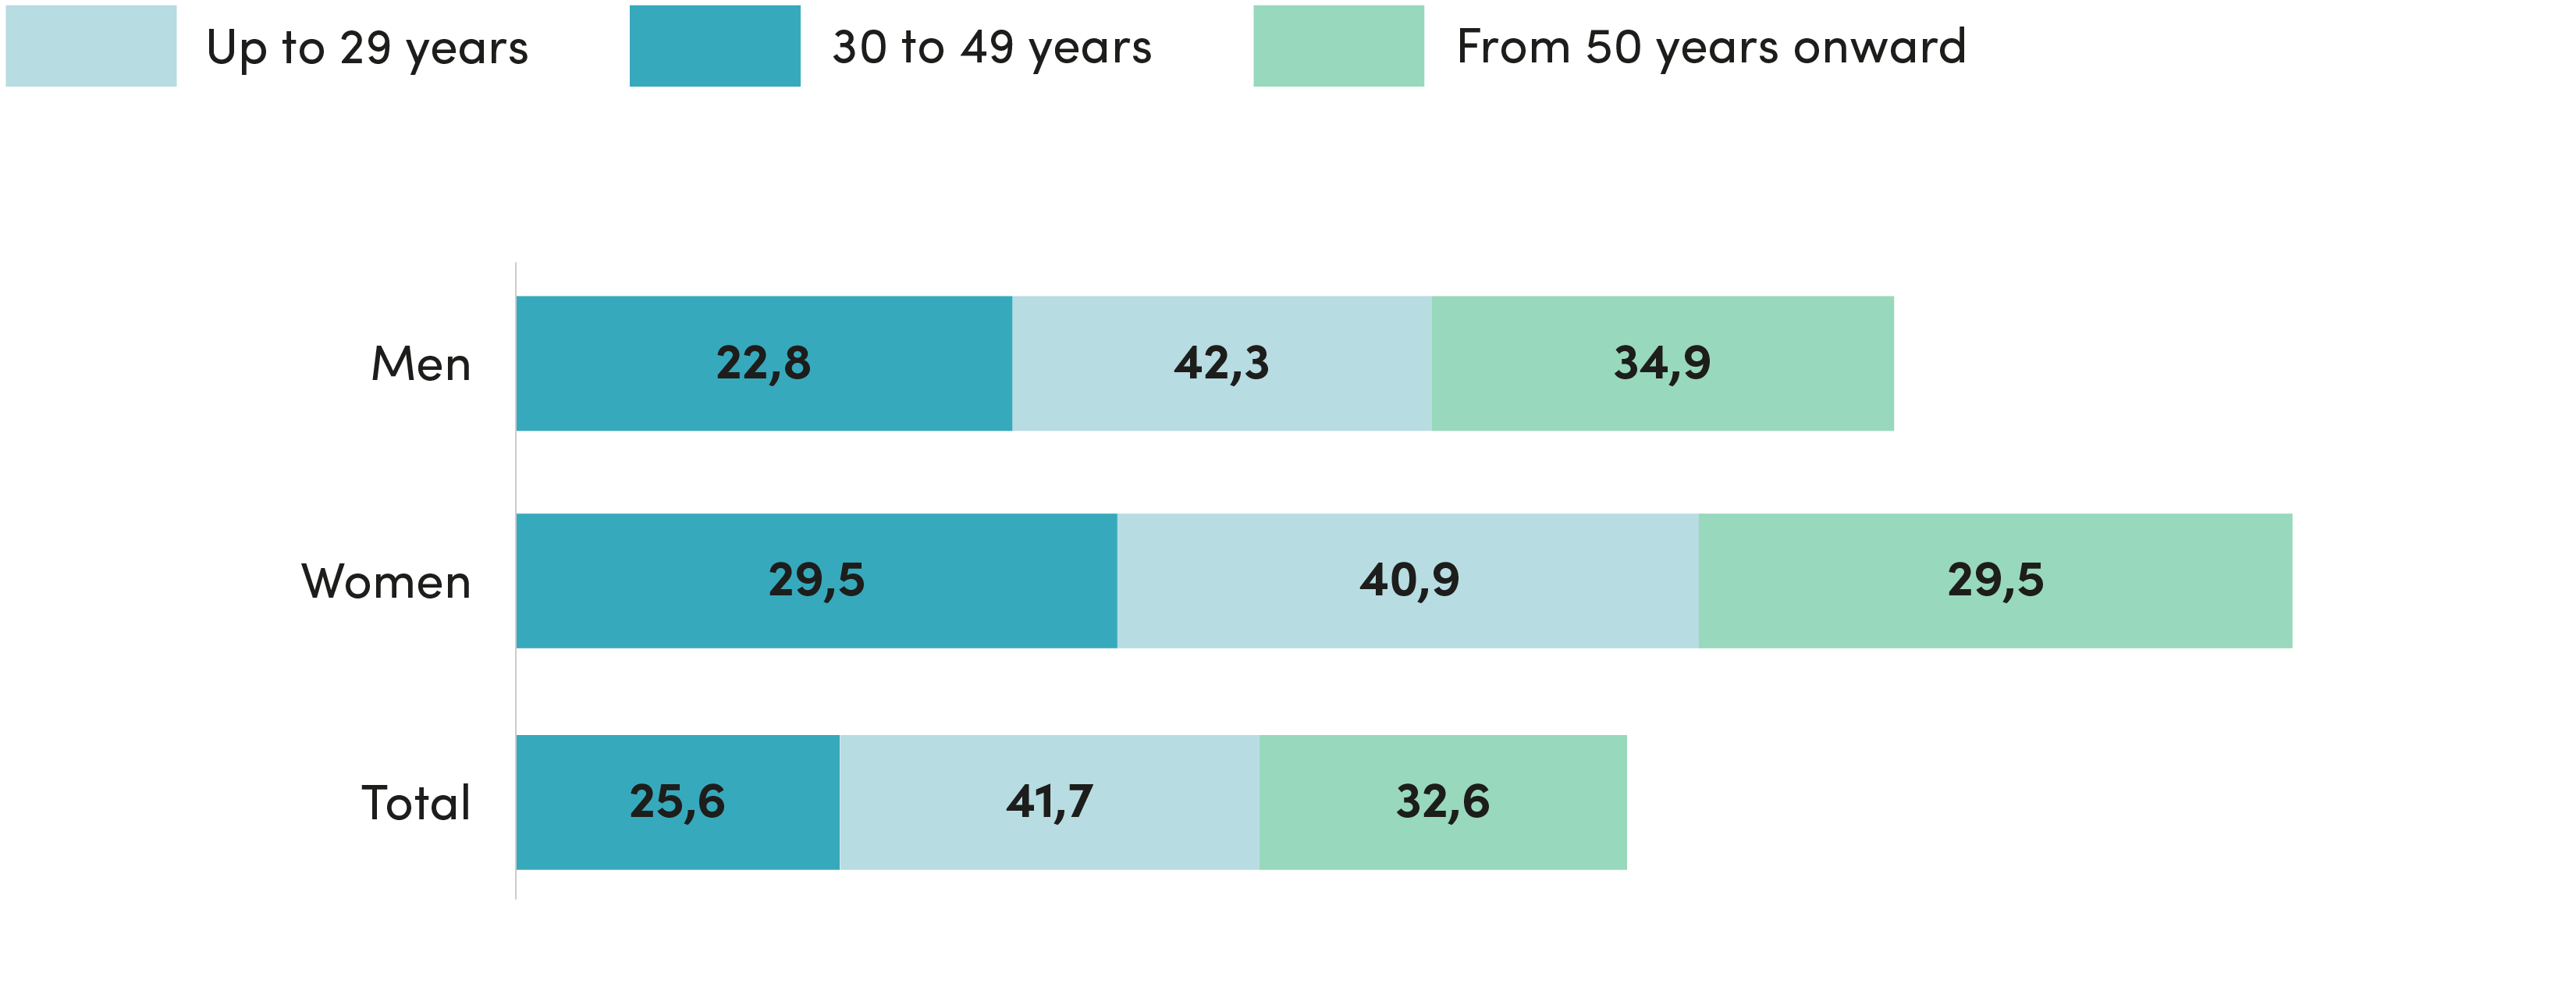
Source: Symbola Foundation elaborations based on INPS data
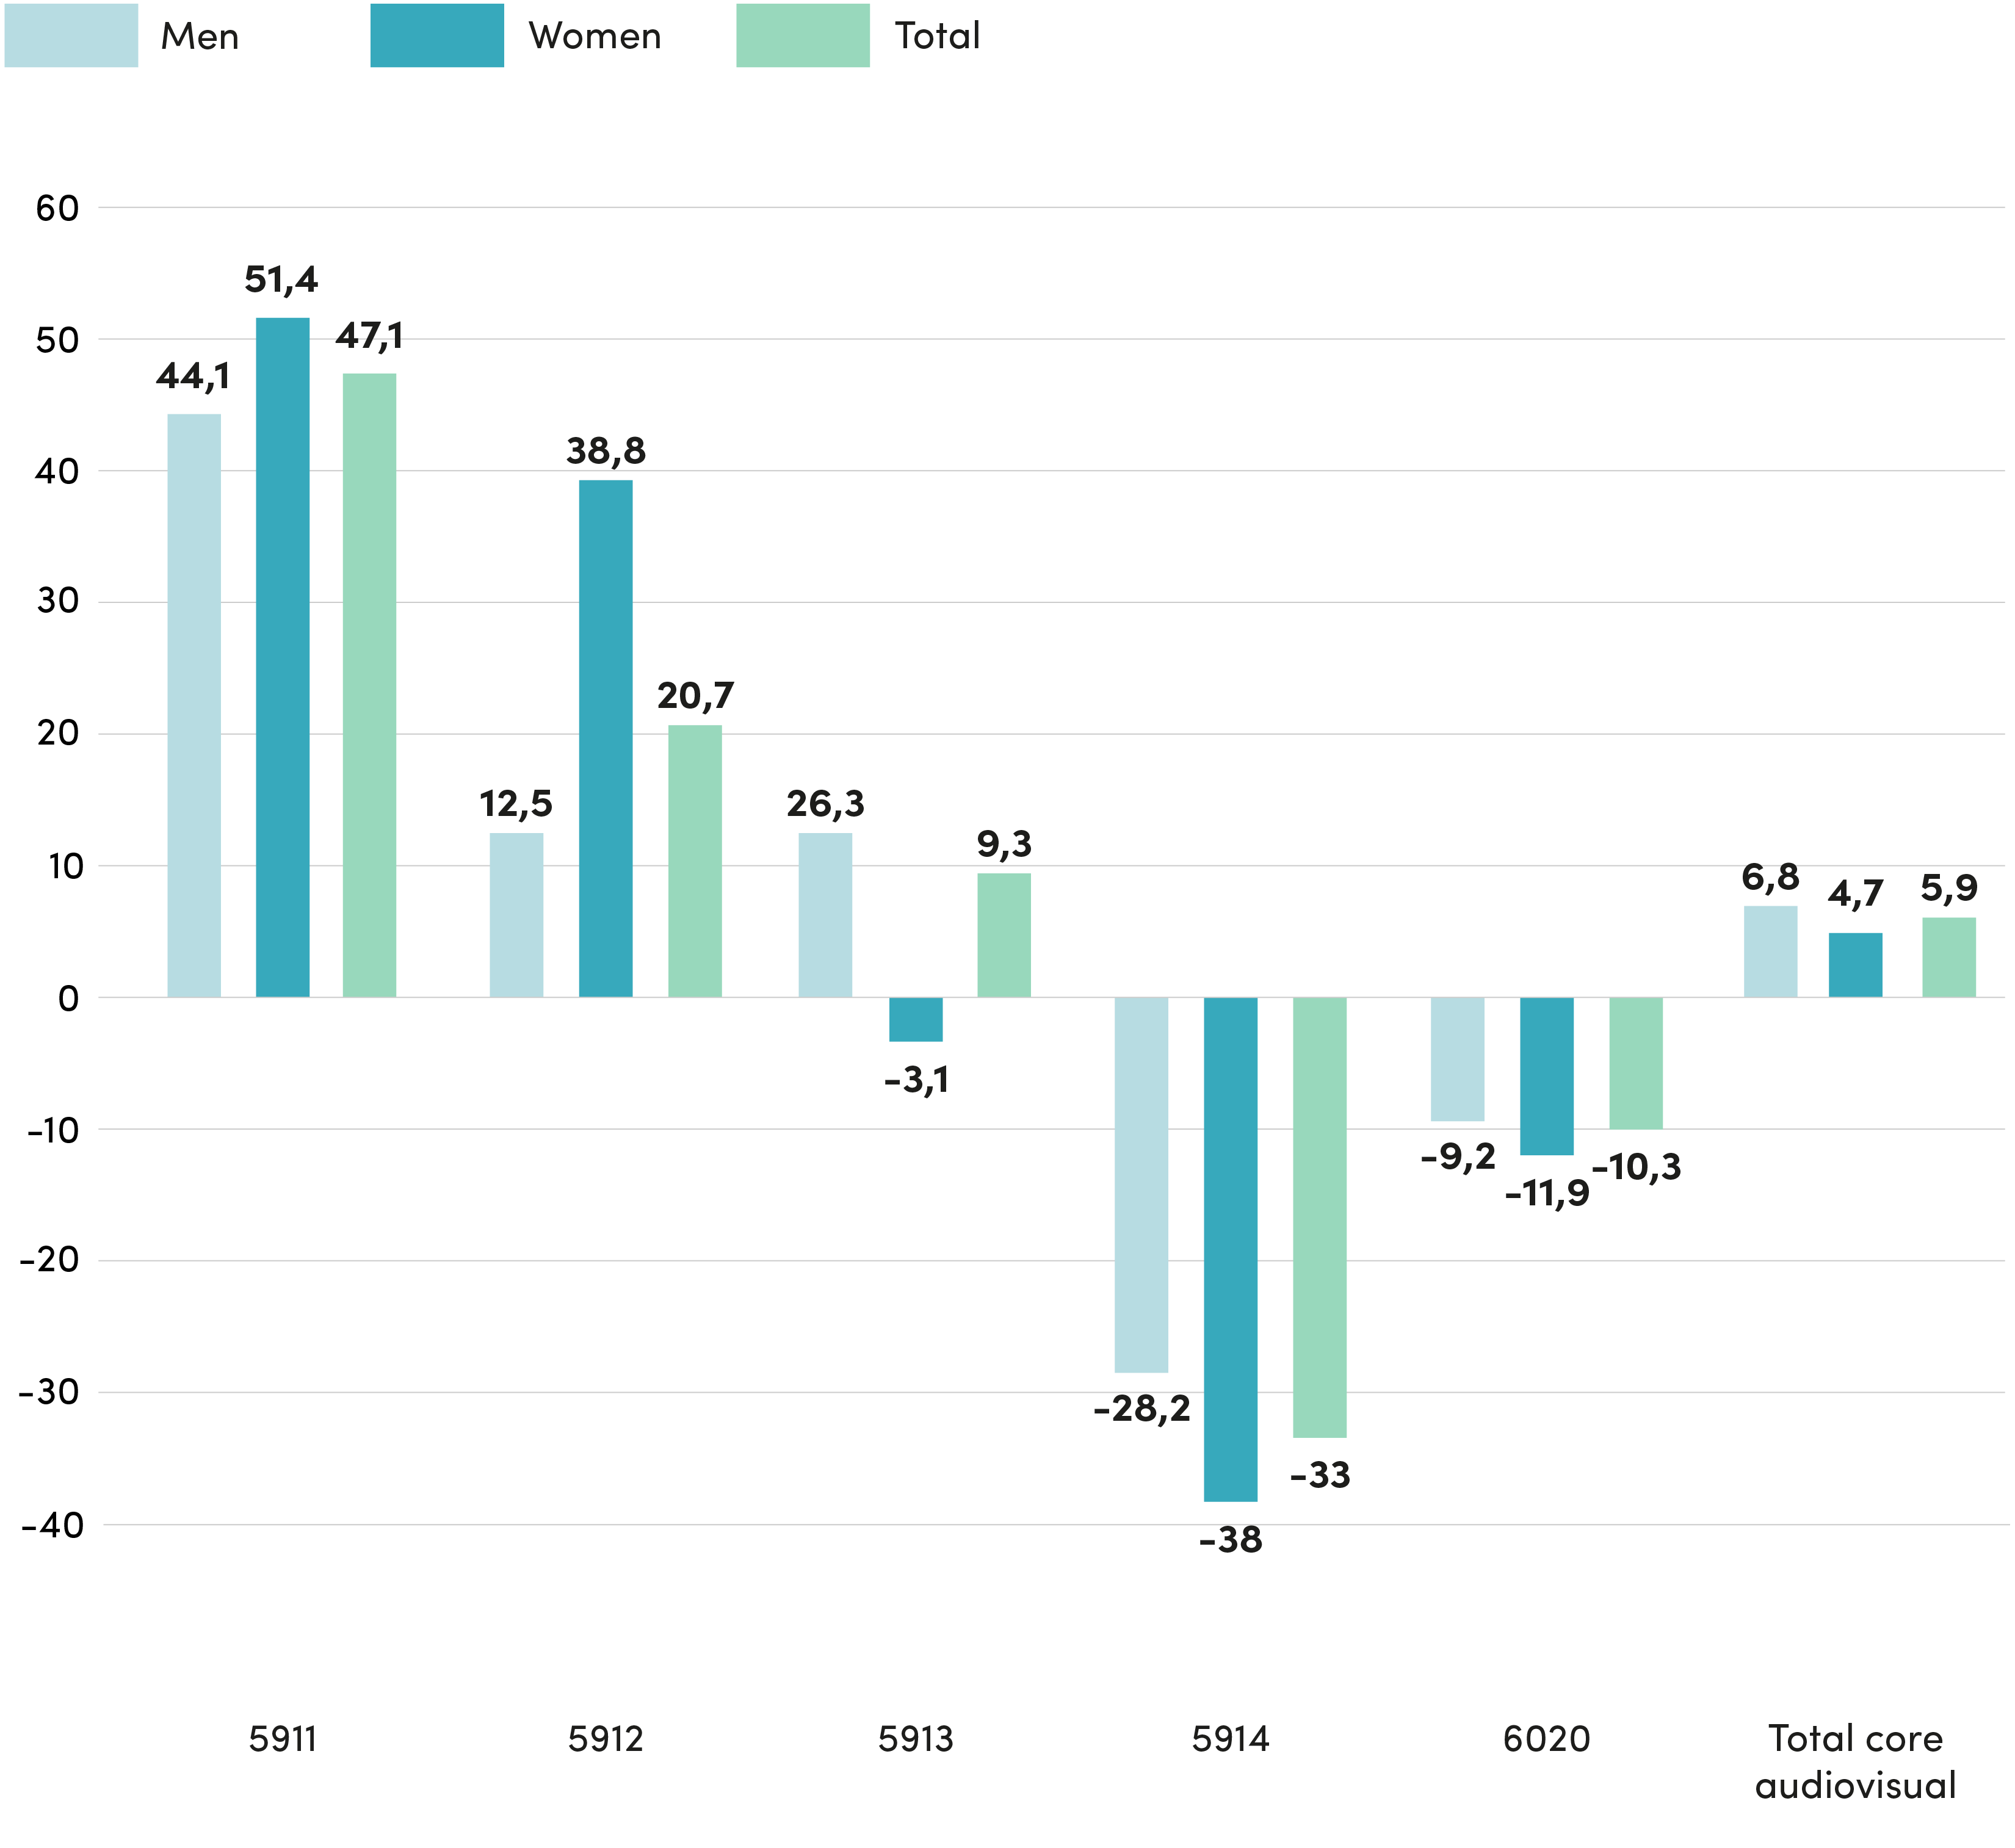
The 2021/2019 comparison data are rather complex and present a high level of variation. On average, female workers in the supply chain record a +4.7% in the two years, not far from the men’s +6.8%.
Within the sectors, the strong recovery of theatrical production is evident (+ 51.4% women for an overall variation of +47.1%). Also post-production recorded important changes for female employment: +38.8%, compared to men’s +12.5%.
2019/2020 variation breakdown of former ENPALS workers within the audiovisual core by activity sectors
(percentage variation)
Fonte: elaborazioni Fondazione Symbola su dati INPS
On the other hand, the distribution sector is less positive. Here, women register a -3.1% compared to a definitely higher +26.1% for men. The INPS data reports negative results for female and men employees in TV programming (respectively -11.9% and -9.2%) and even more, as expected, for exhibition activities (-38.0% and -28.2%, for an average decrease of one-third, -33.0%).
It should be remembered that these data may concern an extremely variable work intensity, given the different roles and days worked according to the sector. Looking at the dynamics of paid days, the hierarchies of the previous data tend to change.
2019/2021 variation breakdown of average annual paid days of former ENPALS workers in the audiovisual core by activity sectors
(variation in the number of days)
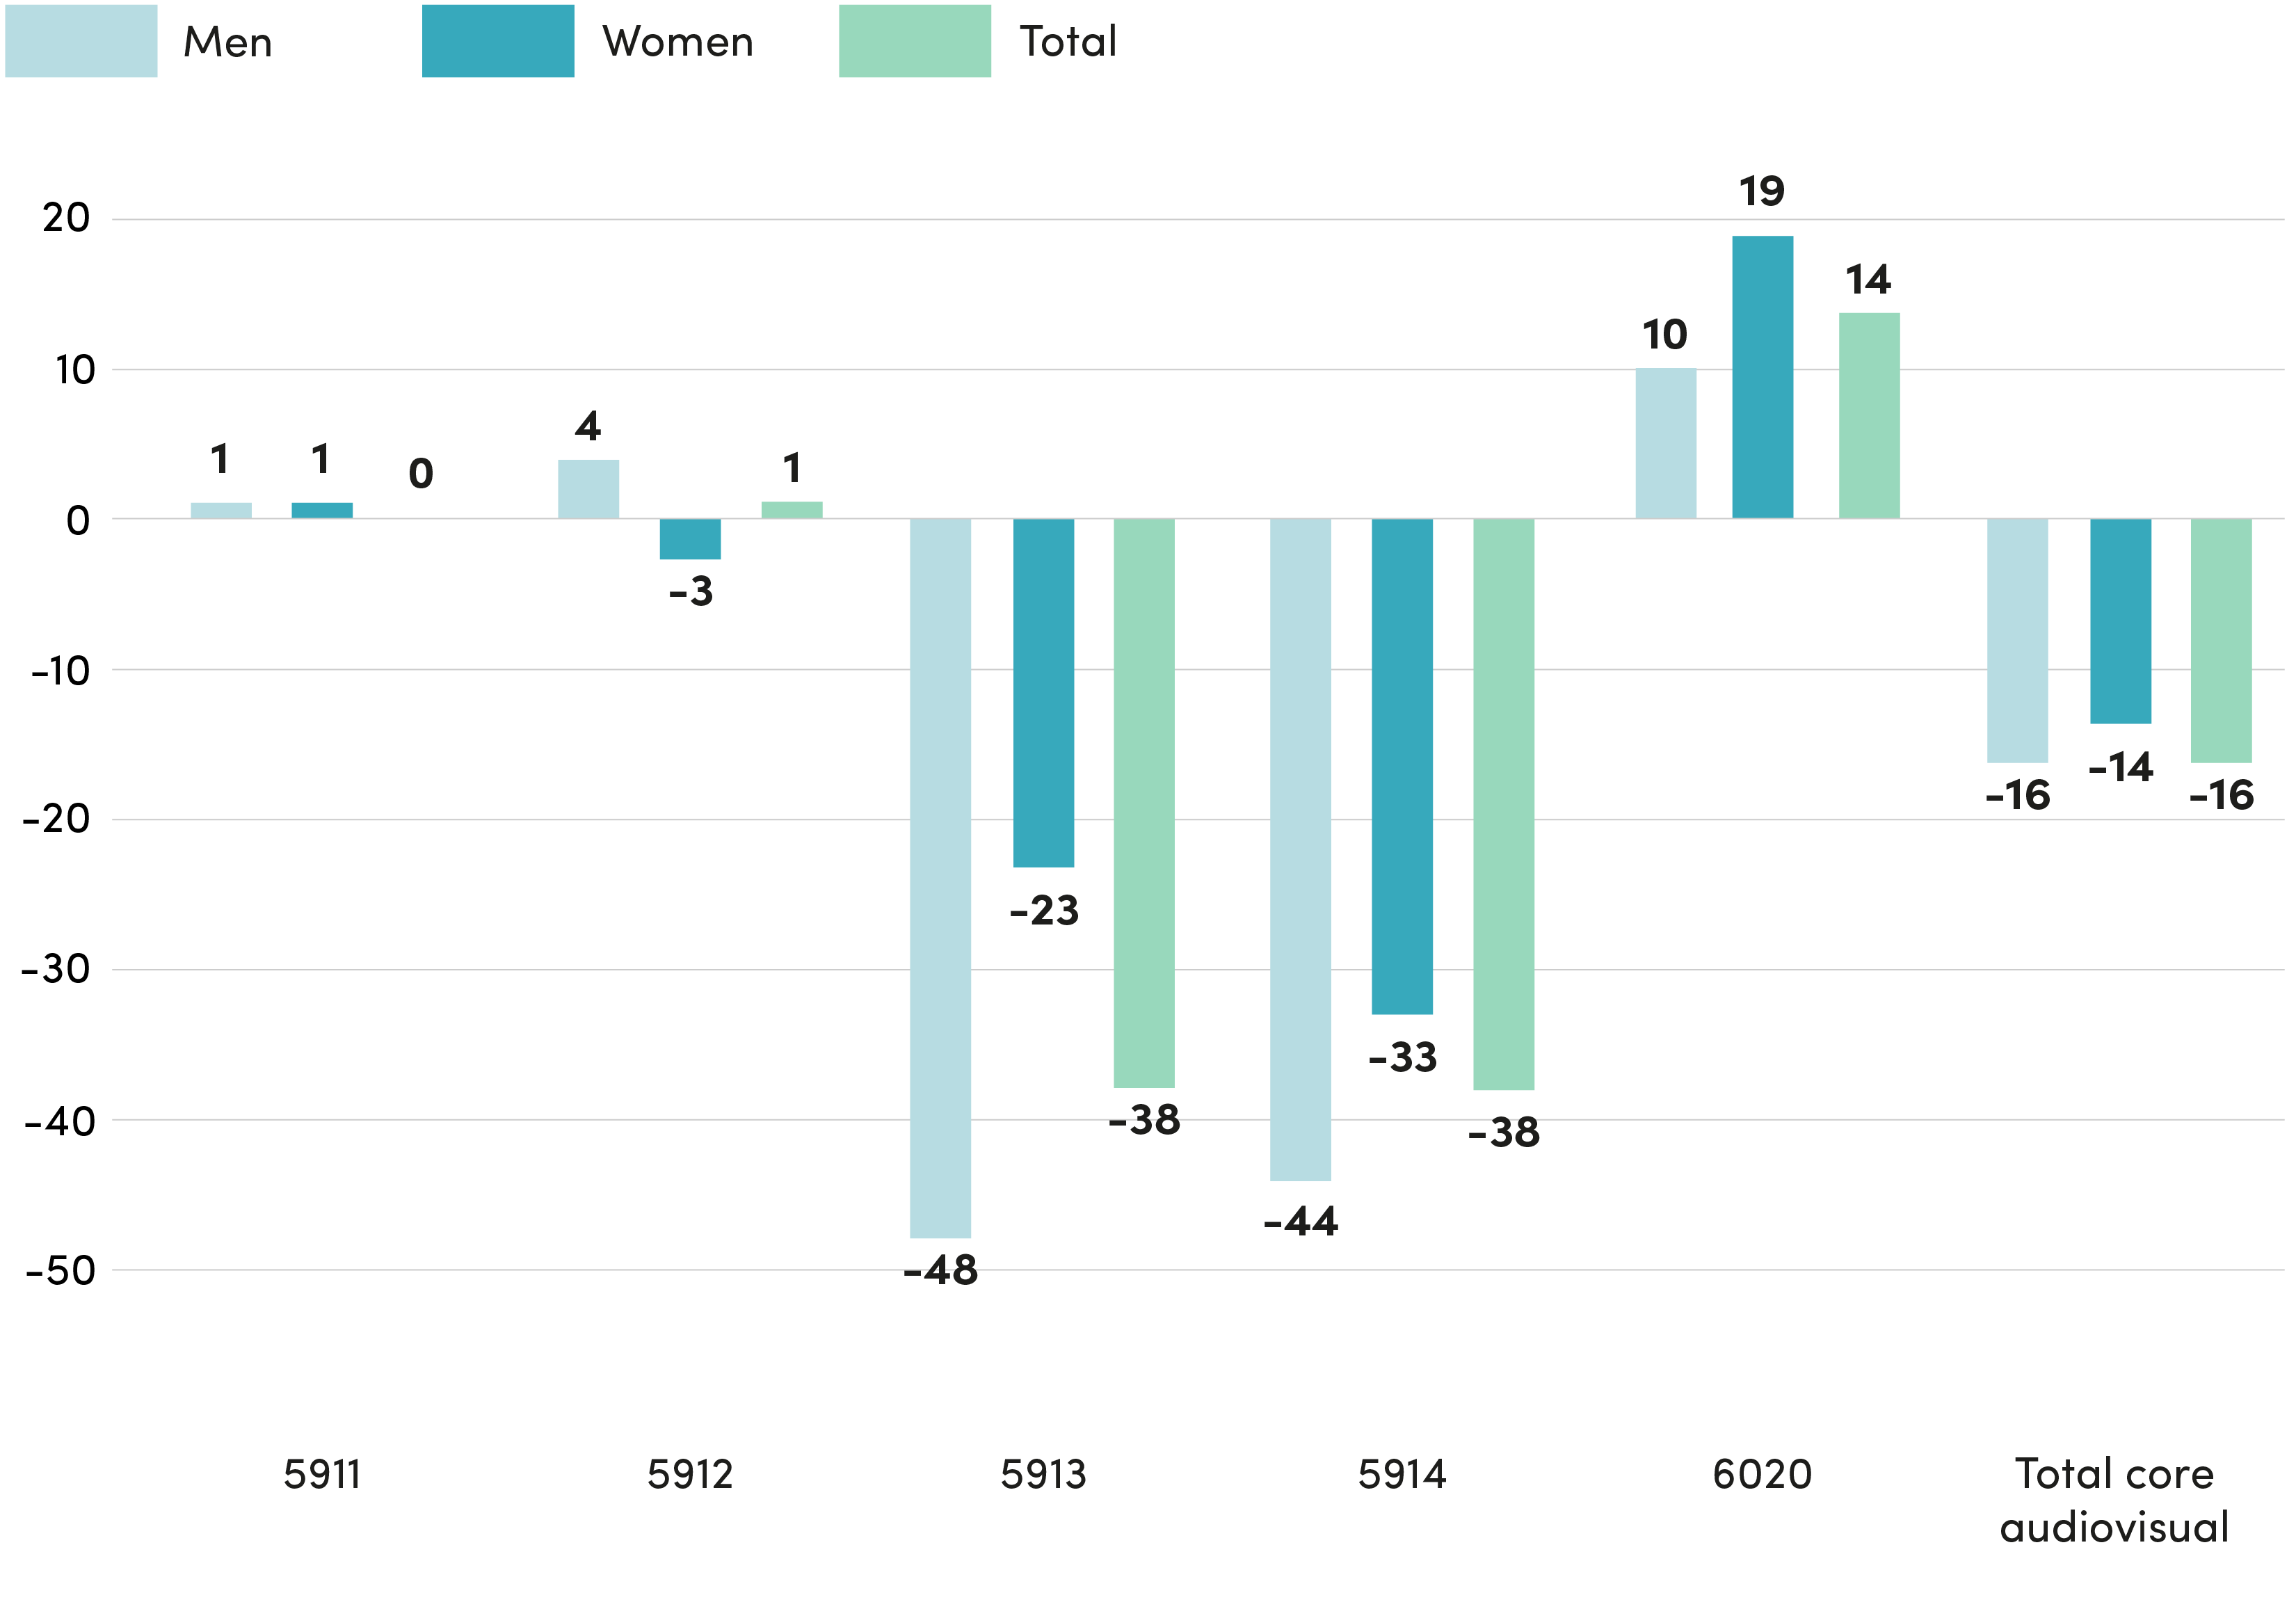
Source: Symbola Foundation elaborations based on INPS data
No major variation can be found in the annual count of paid days in production and post-production. The only positive data concerns TV programming (+14 days on average, for women +19), whereas exhibition records negative figures (-33 days for women, -44 for men, which is even worse), but this time also distribution (-38 on average, -23 for women and -48 for men). Results as such suggest a rise in irregular worker counts.
Based on INPS data, women’s professional groups in the supply chain can be easily assessed.
Breakdown of former ENPALS women employees in the audiovisual core by profession group
Year 2021 (in percentage)
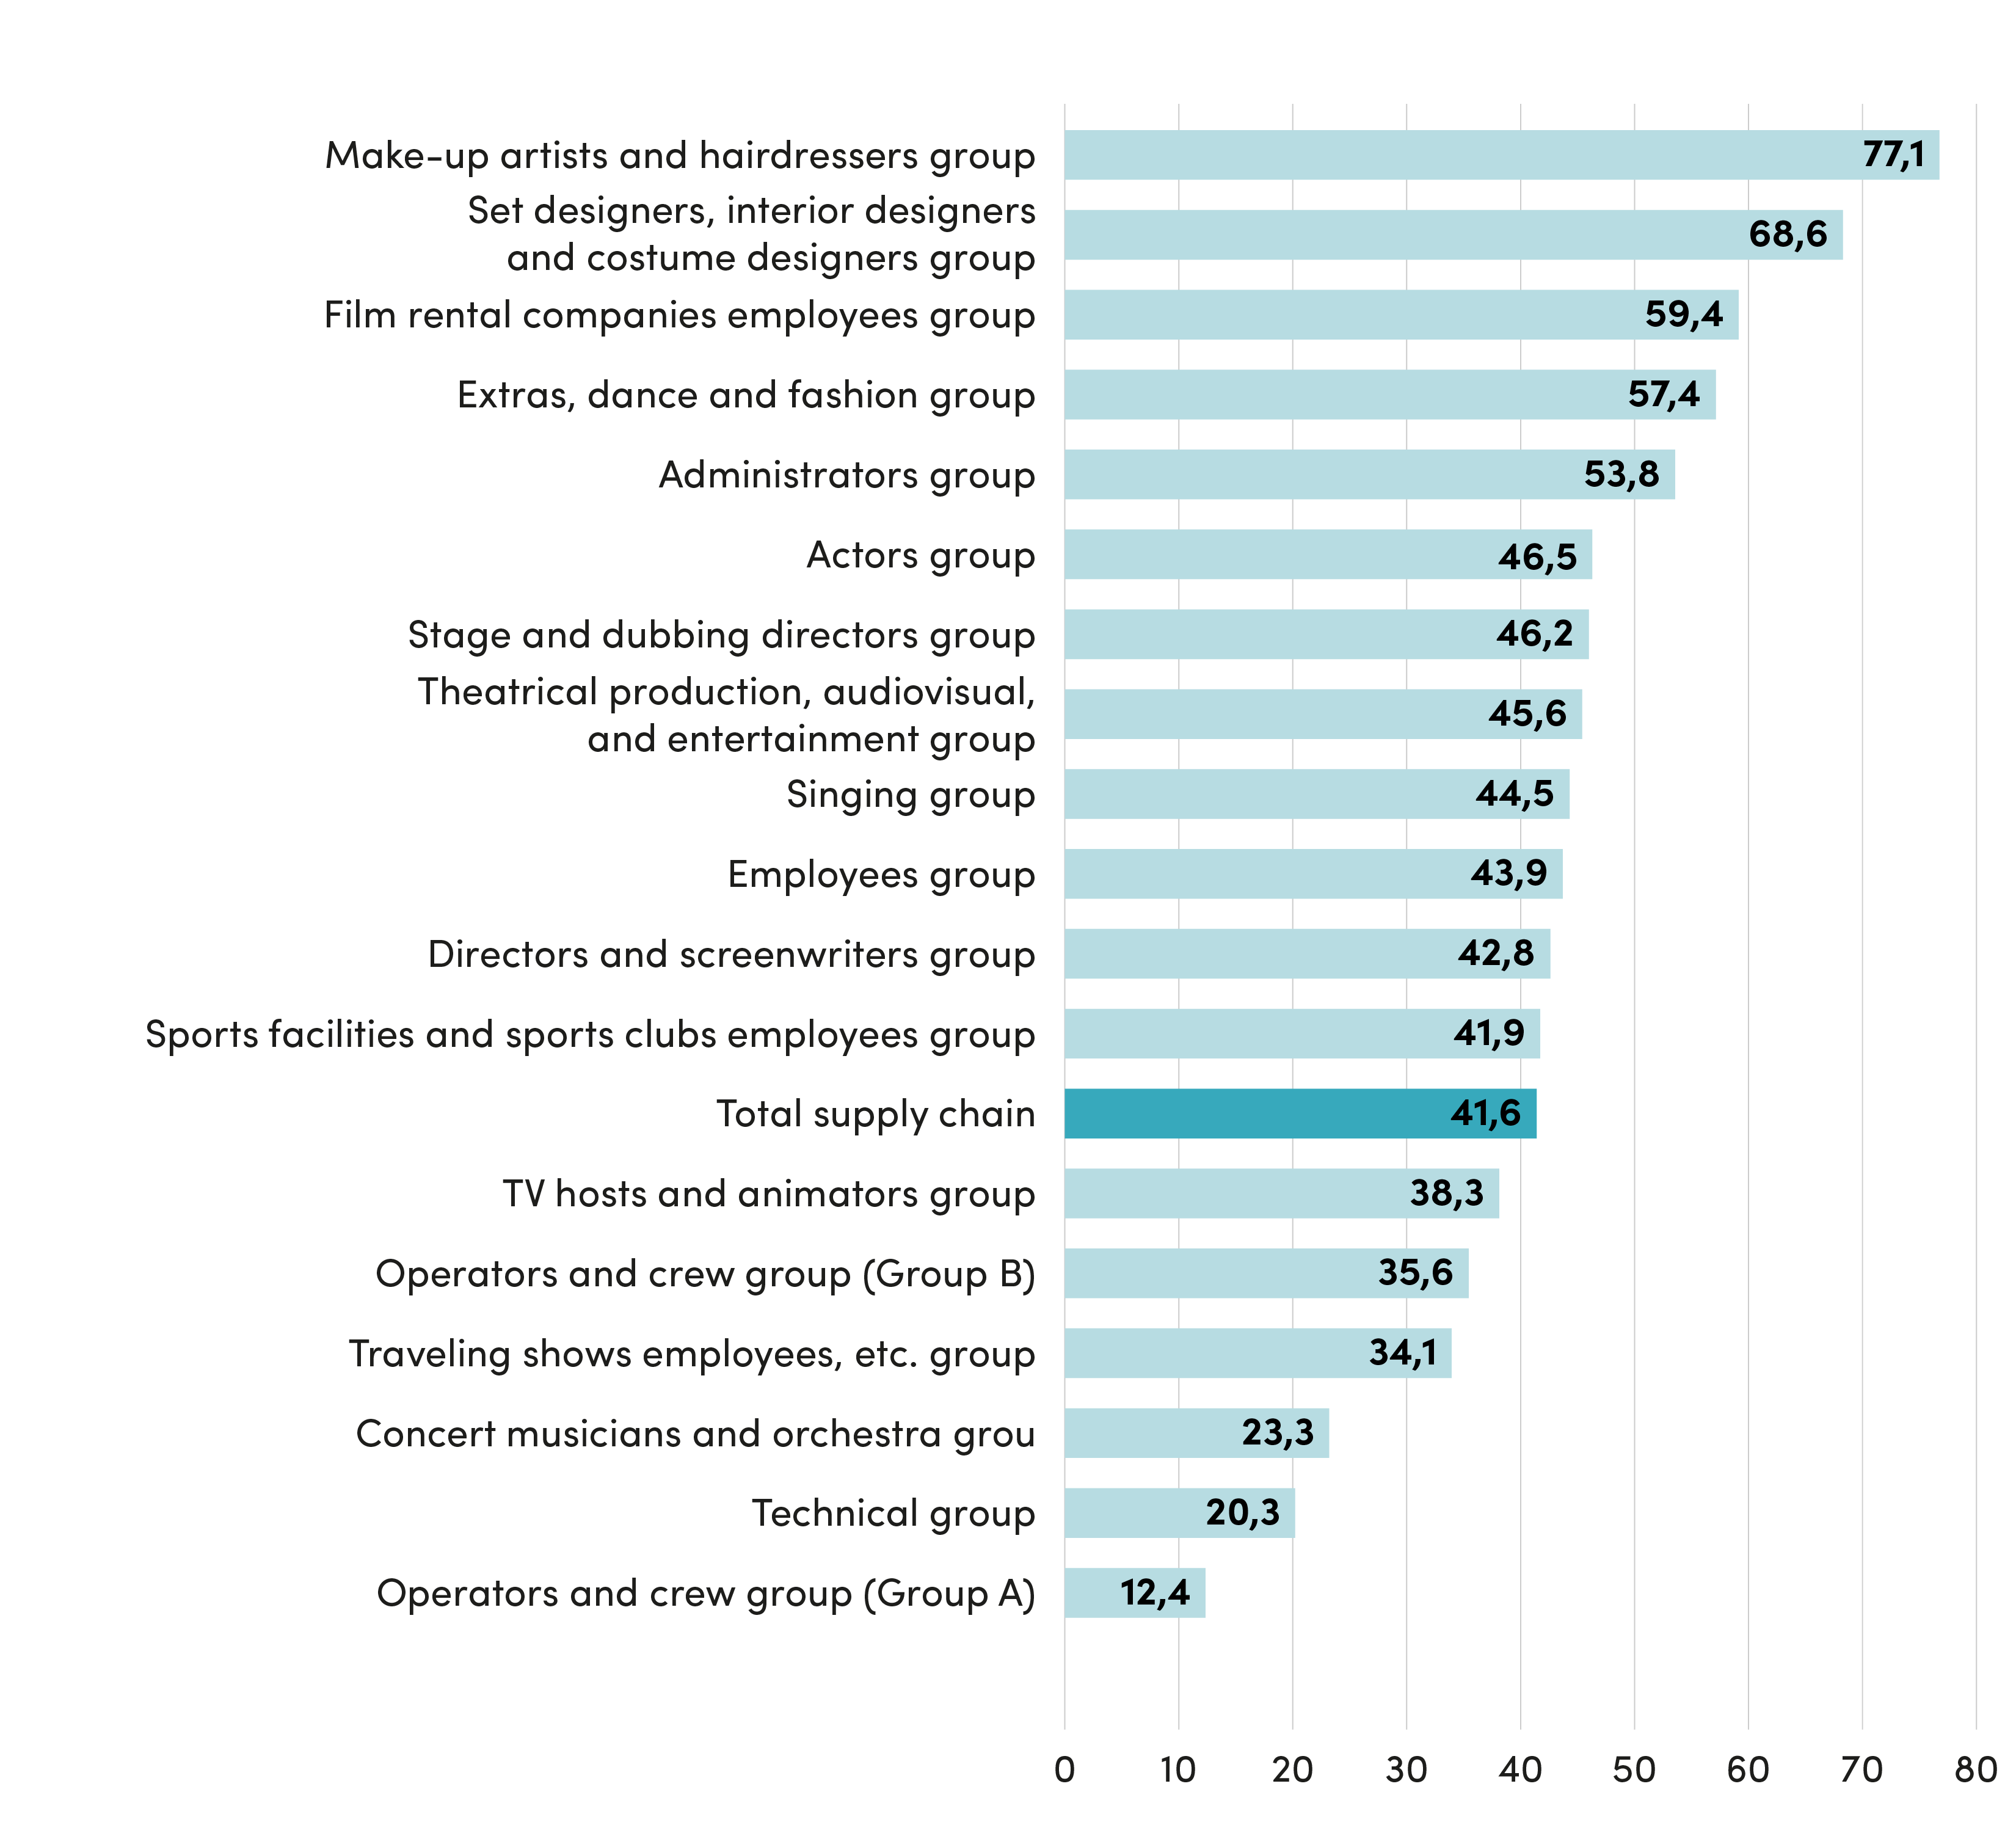
Source: Symbola Foundation elaborations based on INPS data
| Men | Women | Total | % | |
| Make-up artists and hairdressers group | 158 | 531 | 689 | 77.1 |
| Set designers, interior designers and costume designers group | 436 | 954 | 1,390 | 68.6 |
| Film rental companies employees group | 113 | 165 | 278 | 59.4 |
| Extras, dance and fashion group | 395 | 533 | 928 | 57.4 |
| Administrators group | 36 | 42 | 78 | 53.8 |
| Actors group | 10,566 | 9,180 | 19,746 | 46.5 |
| Stage and dubbing directors group | 42 | 36 | 78 | 46.2 |
| Theatrical production, audiovisual, and entertainment group | 1496 | 1,253 | 2,749 | 45.6 |
| Singing group | 91 | 73 | 164 | 44.5 |
| Employees group | 10,488 | 8,210 | 18,698 | 43.9 |
| Directors and screenwriters group | 2,191 | 1,642 | 3,833 | 42.8 |
| Sports facilities and sports clubs employees group | 72 | 52 | 124 | 41.9 |
| TV hosts and animators group | 976 | 606 | 1,582 | 38.3 |
| Operators and crew group (Group B) | 875 | 484 | 1,359 | 35.6 |
| Traveling shows employees, etc. group | 29 | 15 | 44 | 34.1 |
| Concert musicians and orchestra group | 484 | 147 | 631 | 23.3 |
| Technical group | 2,444 | 624 | 3,068 | 20.3 |
| Operators and crew group (Group A) | 4,292 | 608 | 4,900 | 12.4 |
CREW AND EMPLOYEES
(Group A): Theatrical and audiovisual camera operators, assistant camera operators, theatrical employees, theater employees, employees of audiovisual companies, still photographers.
(Group B): Horse groomers, projectionists, theater ushers, caretakers, cloakroom attendants, cleaners and porters; ushers, caretakers, cloakroom attendants, cleaners and porters employed by public entertainment organizations; ushers, caretakers, cloakroom attendants, cleaners and porters employed by film production companies, dubbing, and development and printing companies.
The groups related to make-up artists and hairdressers stand out for their feminization rate, representing 77.1% of the total number of workers, but also the share of women as set designers, interior designers, and costume designers is very high (68.6%).
Other professional groups where women outnumber men in the supply chain are employees in film rental companies (59.4%), dance employees, extras and fashion (57.4%), and those engaged in administrative activities (53.8%).
There is also a substantial presence of actresses (46.5%), stage and dubbing directors (46.2%), directors and screenwriters (42.8%), singers (44.5%), women in theatrical, audiovisual, and entertainment production (45.6%), and office employees (43.9%).
Finally, looking at the professional groups in the supply chain, the presence of actresses in the overall production sector is considerable, representing two-thirds. With a much lower share, the second position is for female production managers, production supervisors, production secretaries, script supervisors, location managers, casting directors, etc. (7.9%).
Breakdown of professional groups ratio among former ENPALS workers within the audiovisual core sectors
Year 2021 (in percentage)
| Sectors | Professional group | Share% | Professional group | Share% | |
| 5911 | Theatrical, video & TV production activities | Actresses | 66.0 | Theatrical, audiovisual and entertainment production. | 7,9 |
| 5912 | Theatrical, video & TV post-production activities | Employees | 36.8 | Actors | 29,7 |
| 5913 | Theatrical, video & TV distribution activities | Film rental companies employees | 44.1 | Employees | 33,4 |
| 5914 | Exhibition activities | Employees | 48.4 | Operators and crew (Group B) | 22,3 |
| 6020 | TV programming & broadcasting activities | Employees | 59.2 | Actors | 12,2 |
Source: Symbola Foundation elaborations based on INPS data
Within post-production activities, the most consistent professional group comprises employees (36.8%), followed by a significant share of actresses (29.7%).
As for distribution, the highest count of women employees is in rental companies (44.1%), followed by another substantial share concerning women employees (33.4%) tout court. Within exhibition activities, nearly half (48.4%) are employed, while another significant percentage can be found among the Group B operators and crew (projectionists, ushers, caretakers, cloakroom attendants, cleaners, etc.: 22.3%).
Finally, within the TV programming and broadcasting activities, female employees are a very high and predominant share of workers (59.2%), followed at a considerable distance by actresses (12.0%).