The business system of the audiovisual core
Starting from the latest Istat data available relating to the Statistical Archive of Active Businesses, the businesses in the film and television chain (hereby defined as the audiovisual core) count 7,357 companies. 61.5% are active in the theatrical and/or television production stage (4,538), while 1,151 are post-production-related (15.6%). Exhibition (718) and TV programming (730) amount to 9.7% and 9.9%, respectively, while the distribution stage, with its 240 companies, reaches just over 3%.
The employee count stated by the companies involved should be added to these data, totaling 48,9071 with substantial differences per sector, with film and television production falling to 33.1%, post-production to 5.1%, while TV programming rose to 46.6% and film screenings to 11.7%.
[1] Although RAI – Radiotelevisione Italiana S.p.a. and Istituto Luce-Cinecittà are classified as public administrations and, therefore, not tallied as companies, they are included in the study for equal comparison. The data are lower than those estimated in the domestic counts, due to the lack of irregular workers.
Breakdown of active businesses and employment in the audiovisual core* by production sectors
Year 2019 (absolute value)
| Sector | Active businesses | % | Employees | % | |
| 5911 | Theatrical, video & TV production activities | 4,538 | 61.5 | 16,165 | 33.1 |
| 5912 | Theatrical, video & TV post-production activities | 1,151 | 15.6 | 2,487 | 5.1 |
| 5913 | Theatrical, video & TV distribution activities | 240 | 3.3 | 1,722 | 3.5 |
| 5914 | Exhibition activities | 718 | 9.7 | 5,733 | 11.7 |
| 6020 | TV programming & broadcasting activities | 730 | 9.9 | 22,801 | 46.6 |
| TOTAL AUDIOVISUAL CORE | 7,377 | 100.0 | 48,907 | 100.0 |
* Although RAI – Radiotelevisione Italiana S.p.a. and Istituto Luce-Cinecittà are classified as public administrations and, therefore, not tallied as companies, they are included in the study for equal comparison.
Source: Symbola Foundation elaboration on Istat data
Breakdown of active businesses and employment in the audiovisual core* by production sectors
Year 2019 (%)
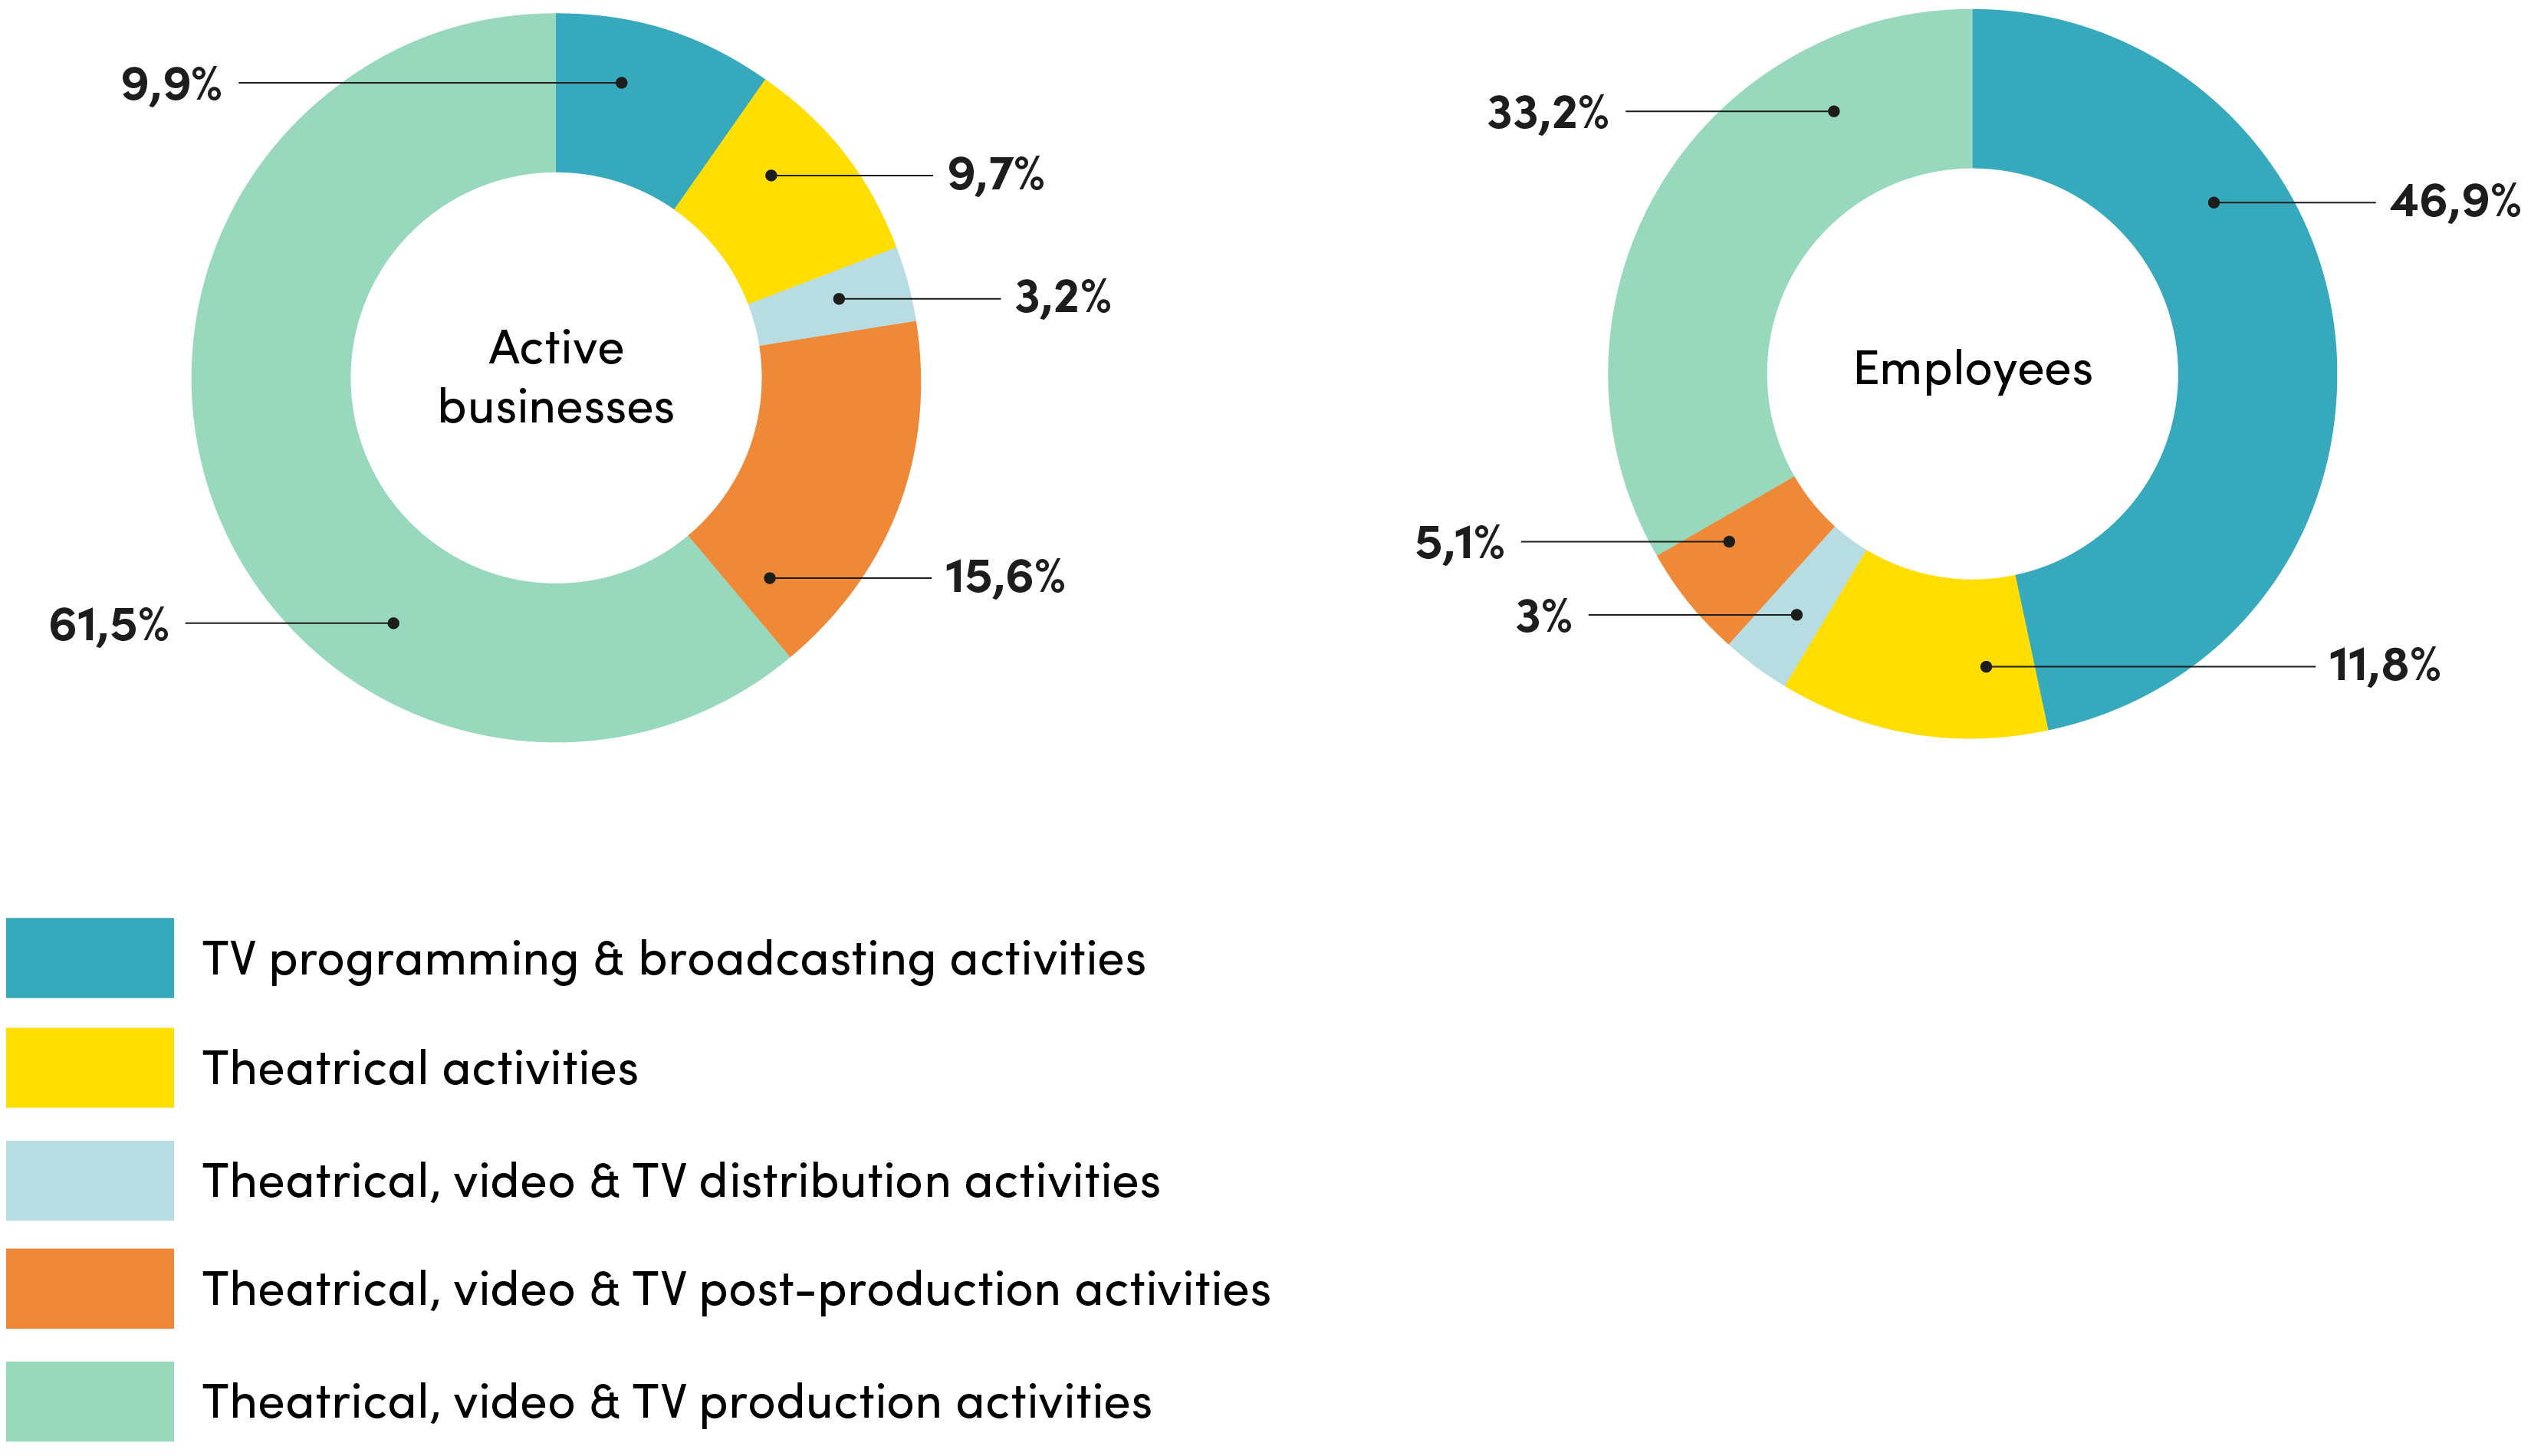
* Although RAI – Radiotelevisione Italiana S.p.a. and Istituto Luce-Cinecittà are classified as public administrations and, therefore, not tallied as companies, they are included in the study for equal comparison.
Source: Symbola Foundation elaboration on Istat data
In the year before the pandemic crisis, audiovisual companies had shown a positive variation compared to the negative figure of the overall non-agricultural sector (+ 0.7% against -2.1%) and growth of employees of +2.2% (total non-agricultural enterprises + 0.6%). In particular, the production, post-production and film distribution sectors stood out, with a growth in companies (respectively + 1.5%, + 2.1%, + 0.8%) and above all of employees (+ 3.9%, + 5.2% and + 4.6%).
Breakdown of active businesses and employees in the audiovisual core* by production sectors
Years 2019/2018 (%)
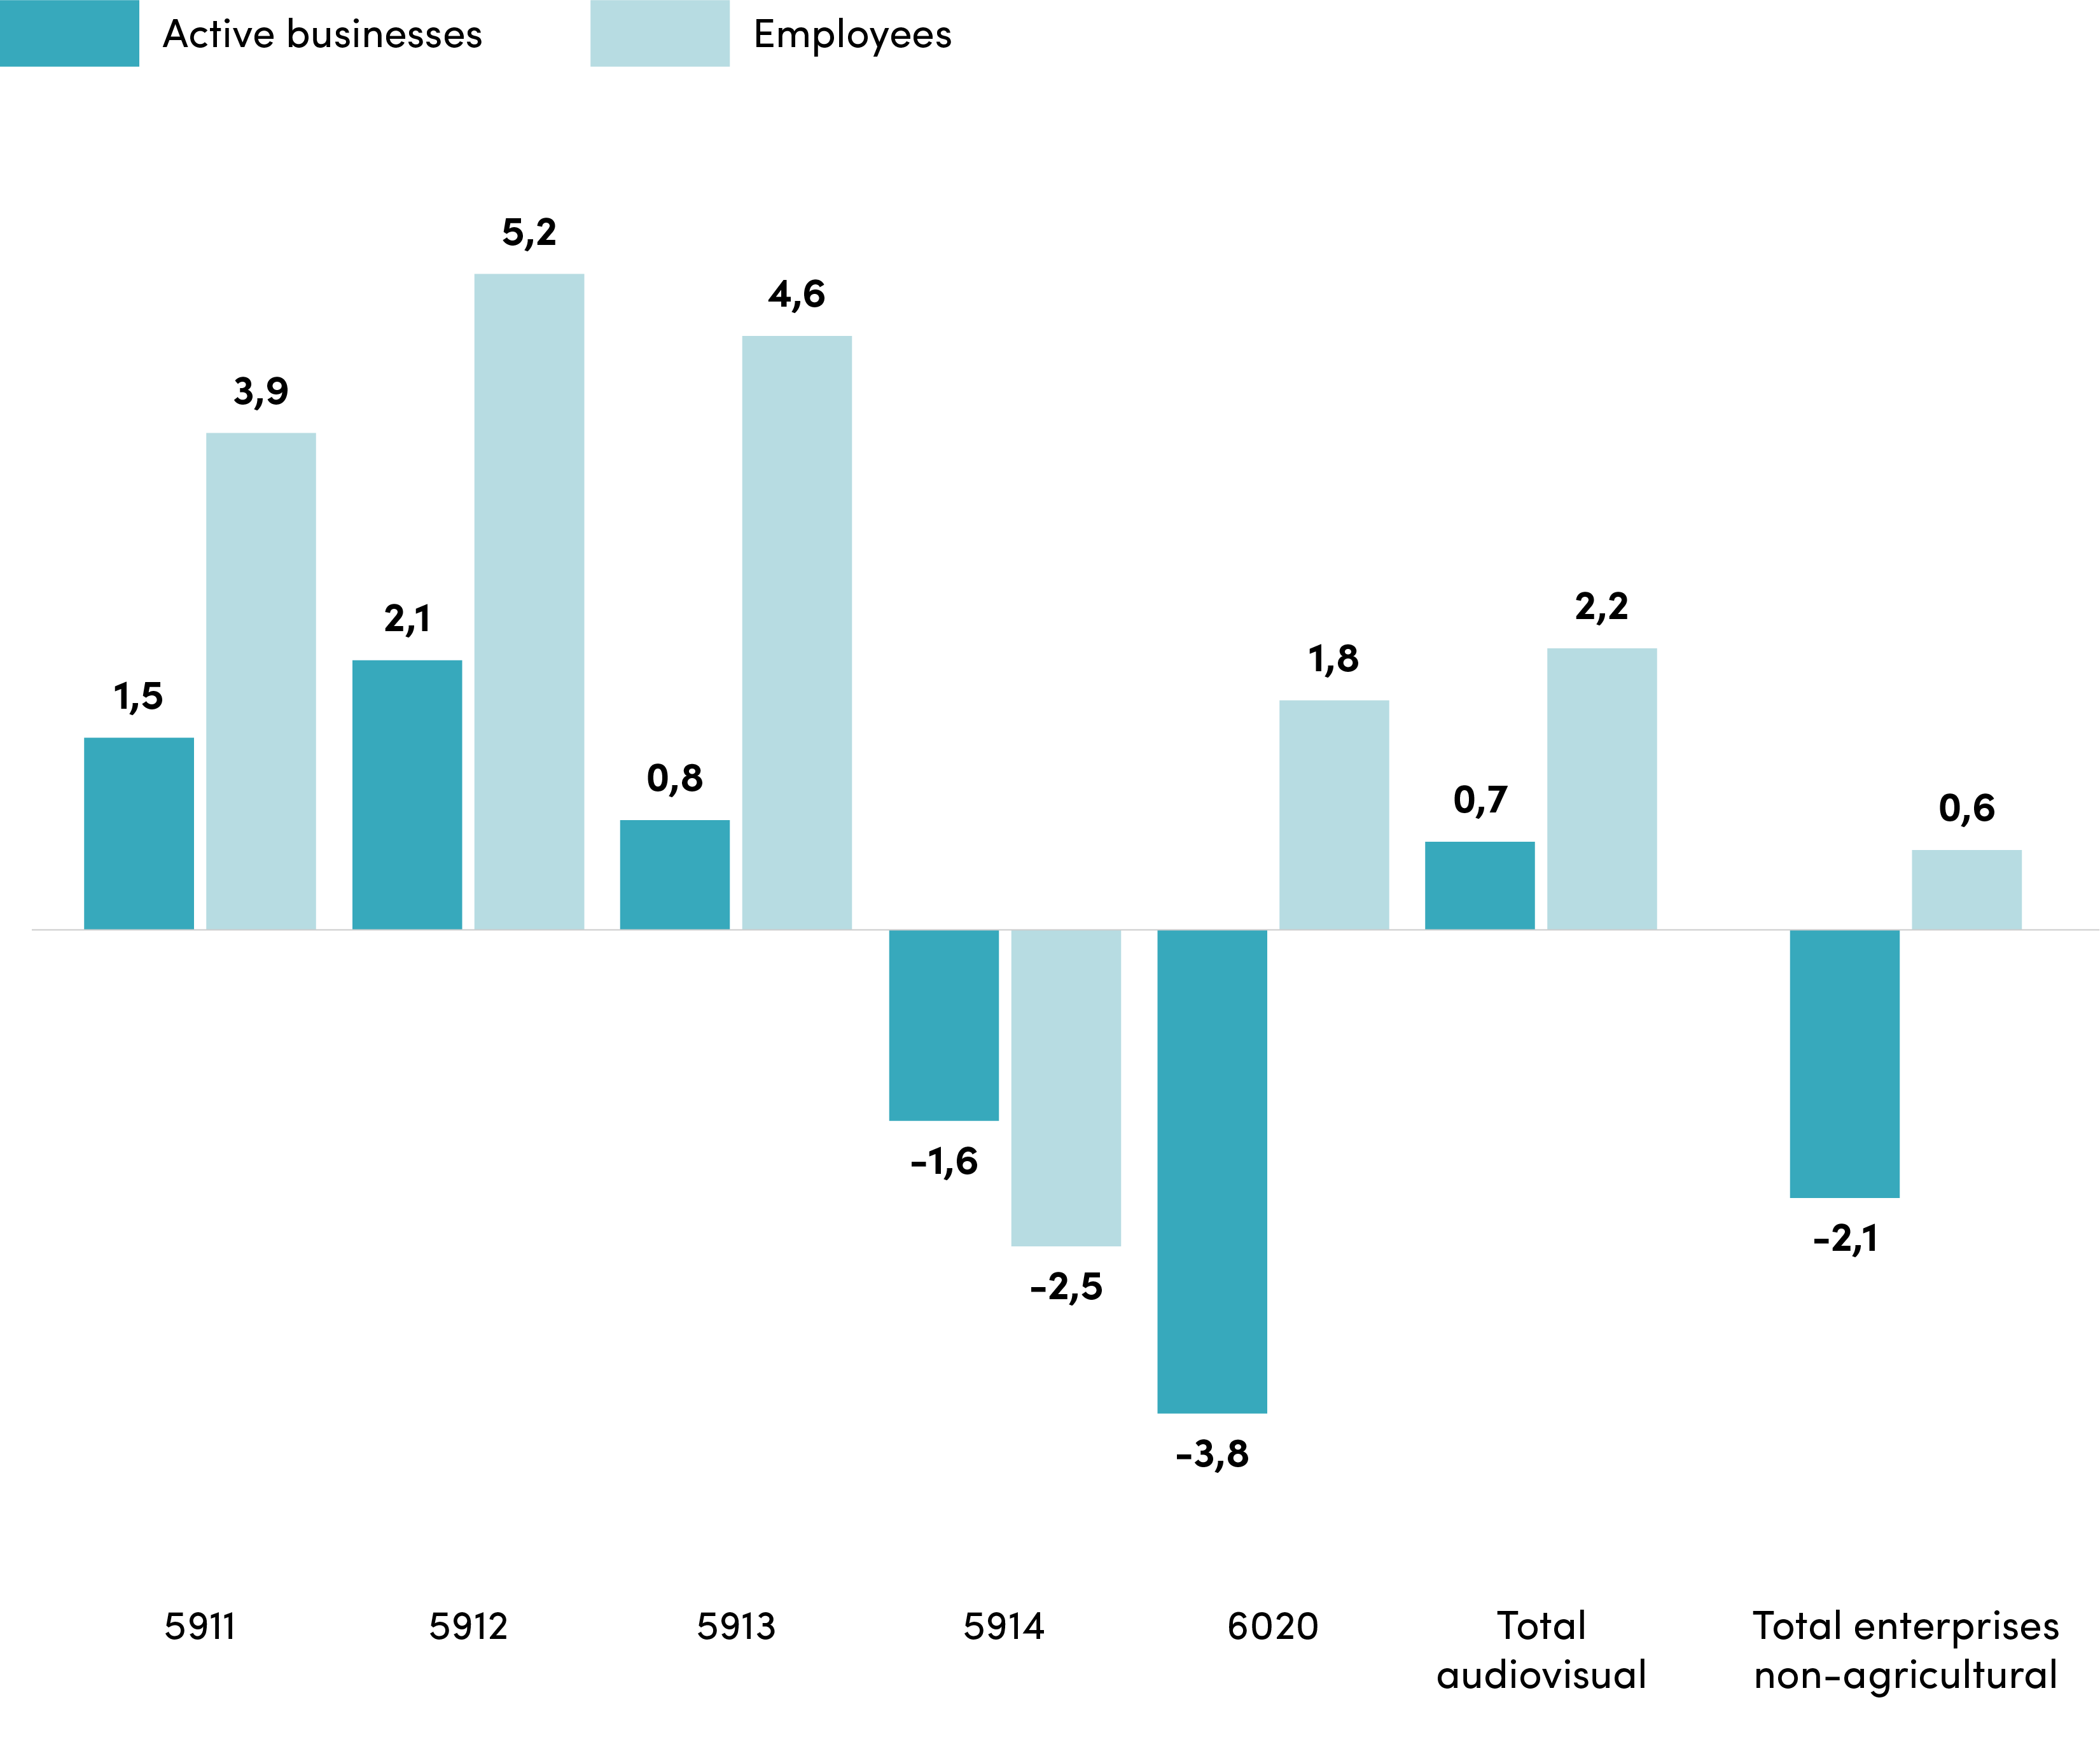
** Although RAI – Radiotelevisione Italiana S.p.a. and Istituto Luce-Cinecittà are classified as public administrations and, therefore, not tallied as companies, they are included in the study for equal comparison.
On the other hand, both figures were negative for the exhibition sector (-1.6% businesses, -2.5% employee count). As for TV programming and broadcasting, the business count was negative (-3.8%), while the employee count had risen (+ 1.6%).
These variations increased the weight of the theatrical production and post-production component on the entire audiovisual system, both in terms of active companies (from 61.0 to 61.5% in the first case, from 15.4% to 15.6% in the second), but above all, of employee count (from 32.5 to 33.2% in the first case, from 4.9% to 5.1% in the second), while the incidence grew much more slowly for distribution and dropped in the other sectors.
These data allowed us to go into further detail from a company size standpoint.
In particular, the average size calculated as the ratio between employees and companies by sector, corresponding to 6.6 employees for the audiovisual industry tout court, made TV programming and broadcasting stand out as the largest business sector (31.2 employees on average,) followed by quite a distance by exhibition and distribution (8.0 and 7.2 respectively), while theatrical production and post-production employed fewer workers (3.6 and 2.2, respectively).
If we look at the second indicator adopted (on average 262.1 K€ per employee), the order among sectors changes, placing theatrical distribution at the top (653.2 K€ per employee), followed by television (364.9 K€ per employee) and at a distance theatrical post-production (142.0 K€ per employee), theatrical production (138.8 K€ per employee) and finally exhibition (135.6 K€ per employee).
Breakdown of average size and turnover per employee of companies active in the audiovisual core* by production sector
Year 2019 (employee per company on the left, turnover per employee on the right)
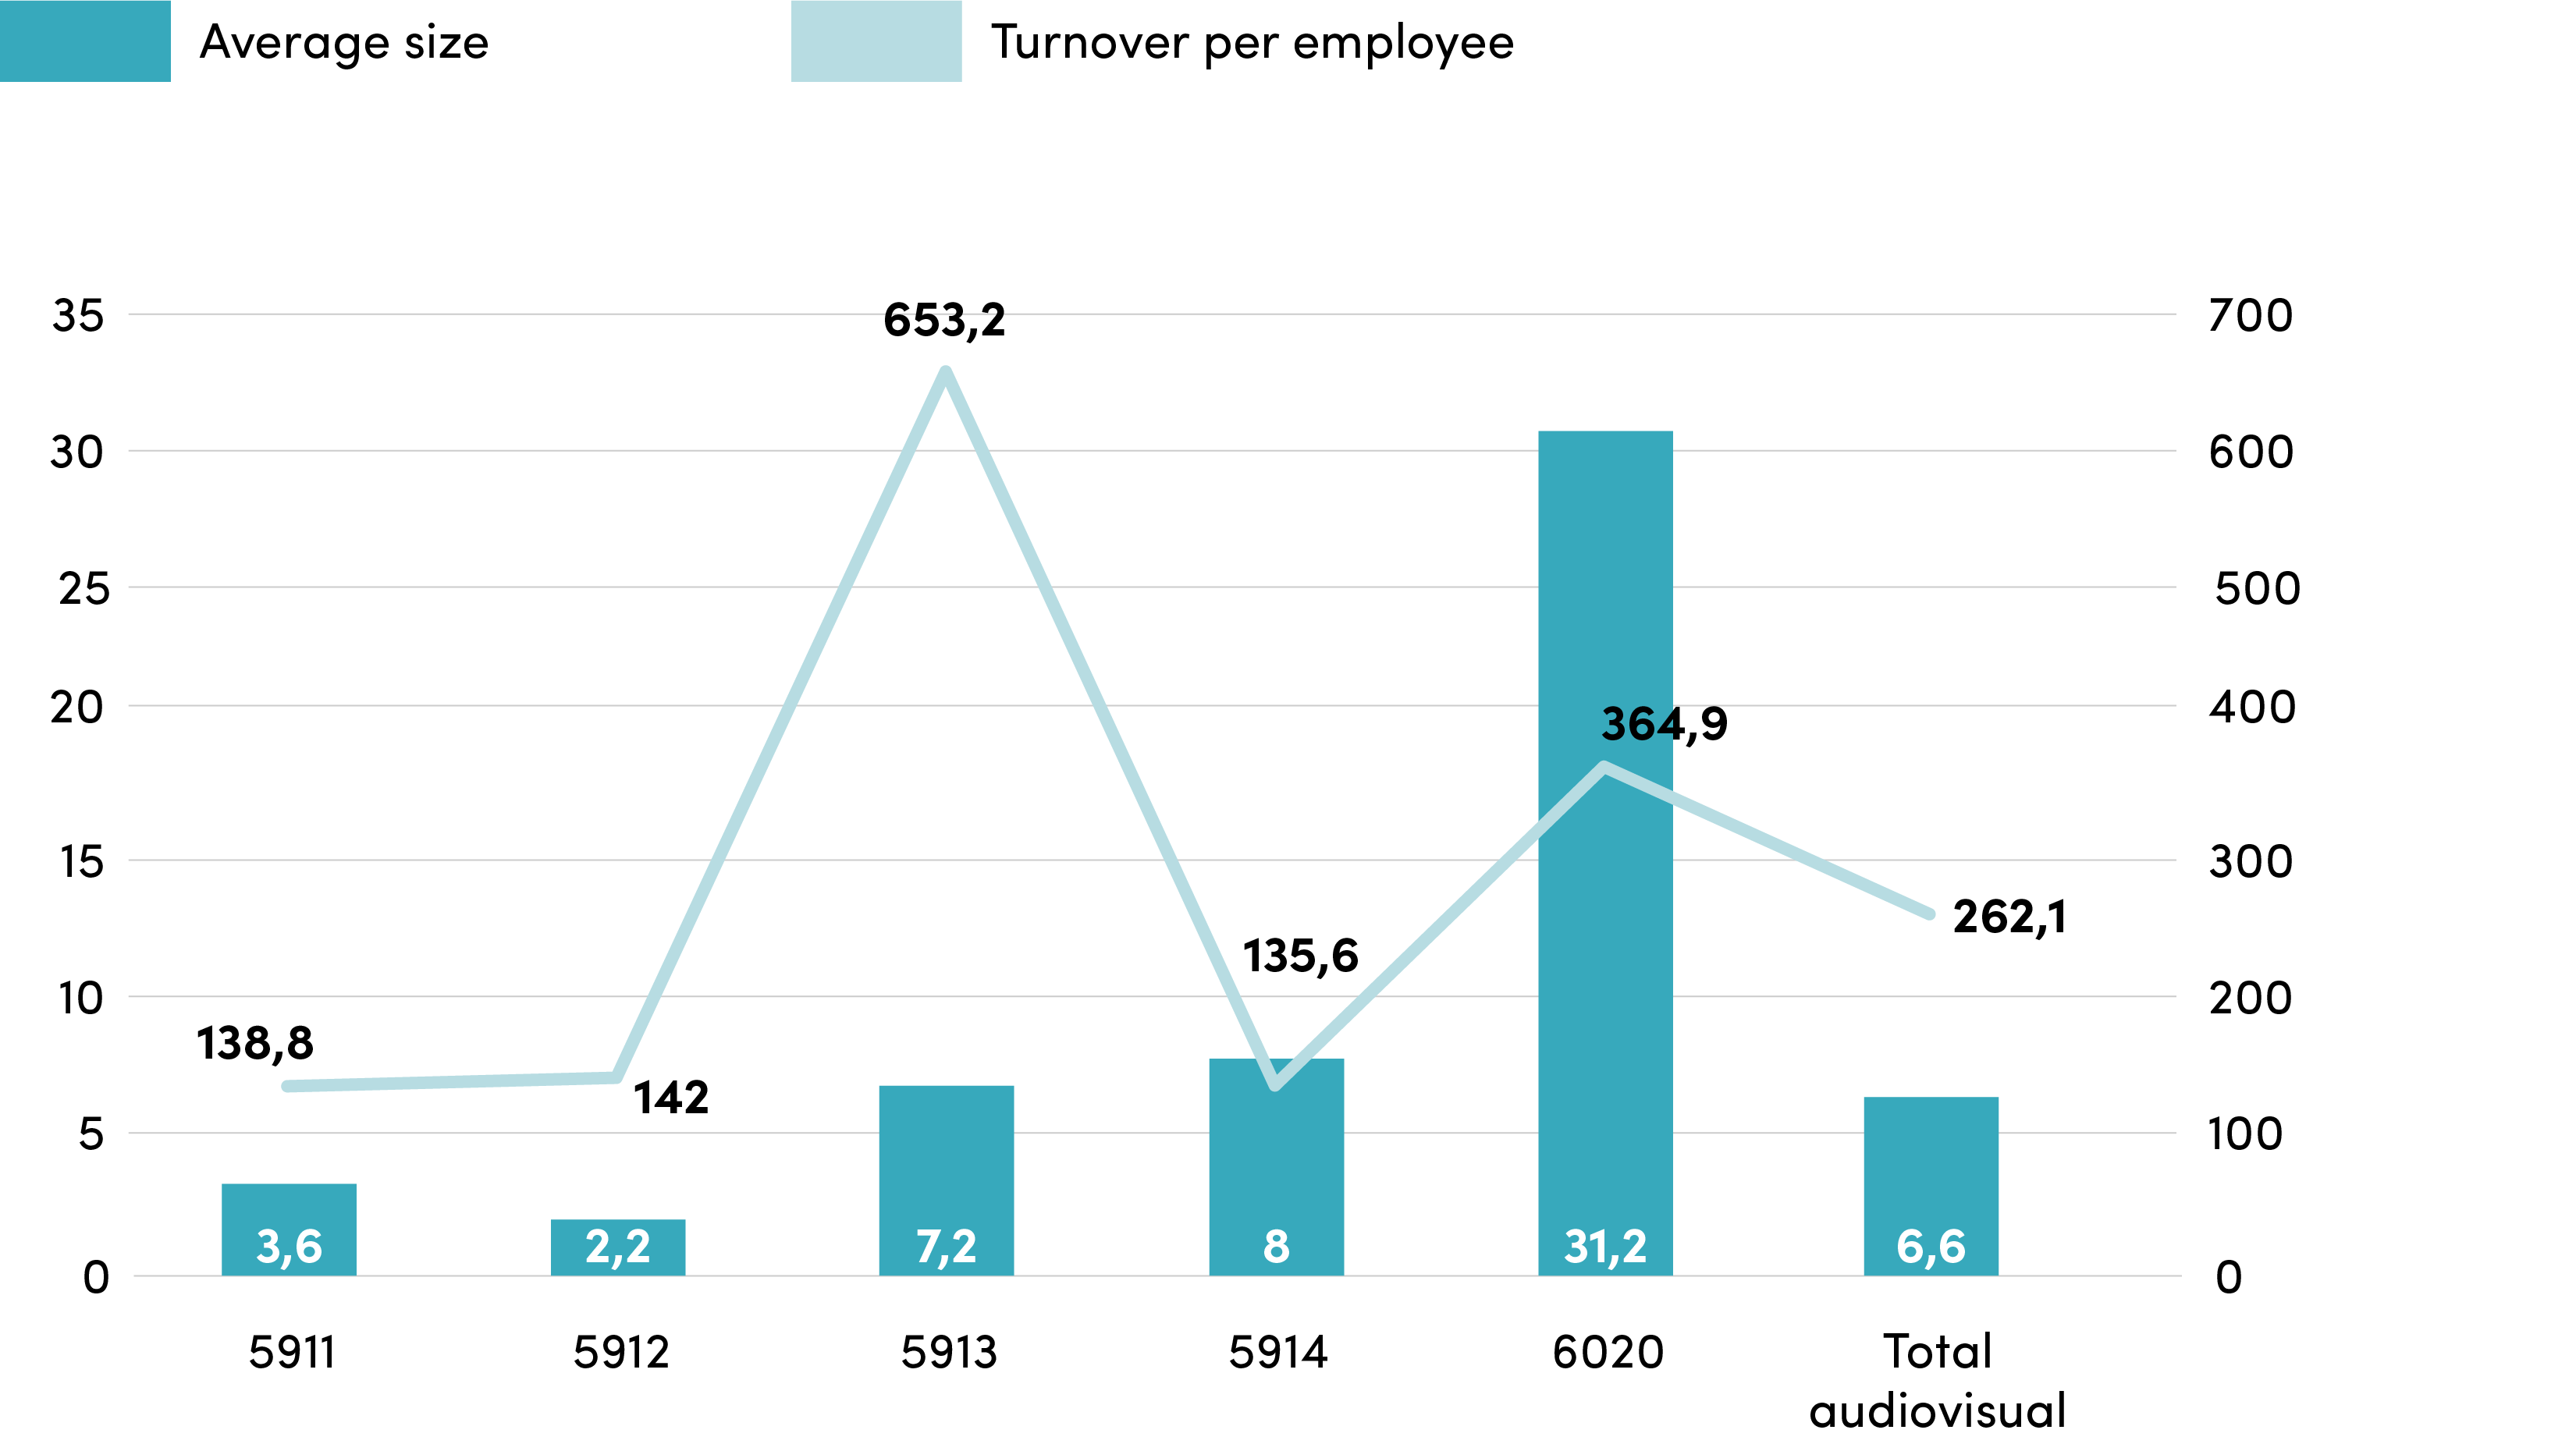
Source: Symbola Foundation elaboration on Istat data
*Although RAI – Radiotelevisione Italiana S.p.a. and Istituto Luce-Cinecittà are classified as public administrations and, therefore, not tallied as companies, they are included in the study for equal comparison.