Employment in 2021
The starting point for quantifying the total number of workers involved in audiovisual activities is the data on domestic employment of the so-called audiovisual core perimeter, consisting of the five ATECO 2007 classes (59.11 – Theatrical, video & TV production activities; 59.12 – Theatrical, video & TV post-production activities; 59.13 – Theatrical, video & TV distribution activities; 59.14 – Exhibition activities; 60.20 – TV programming and broadcasting activities).
These data are expressed in terms of AUW, annual work units , following the conventions adopted in the national account statistics.
This means that a work unit comprises theoretical employees and self-employed workers (divided into self-employed workers and entrepreneurs), who, for example, work for six months each in a year, thus identifying a single work unit.
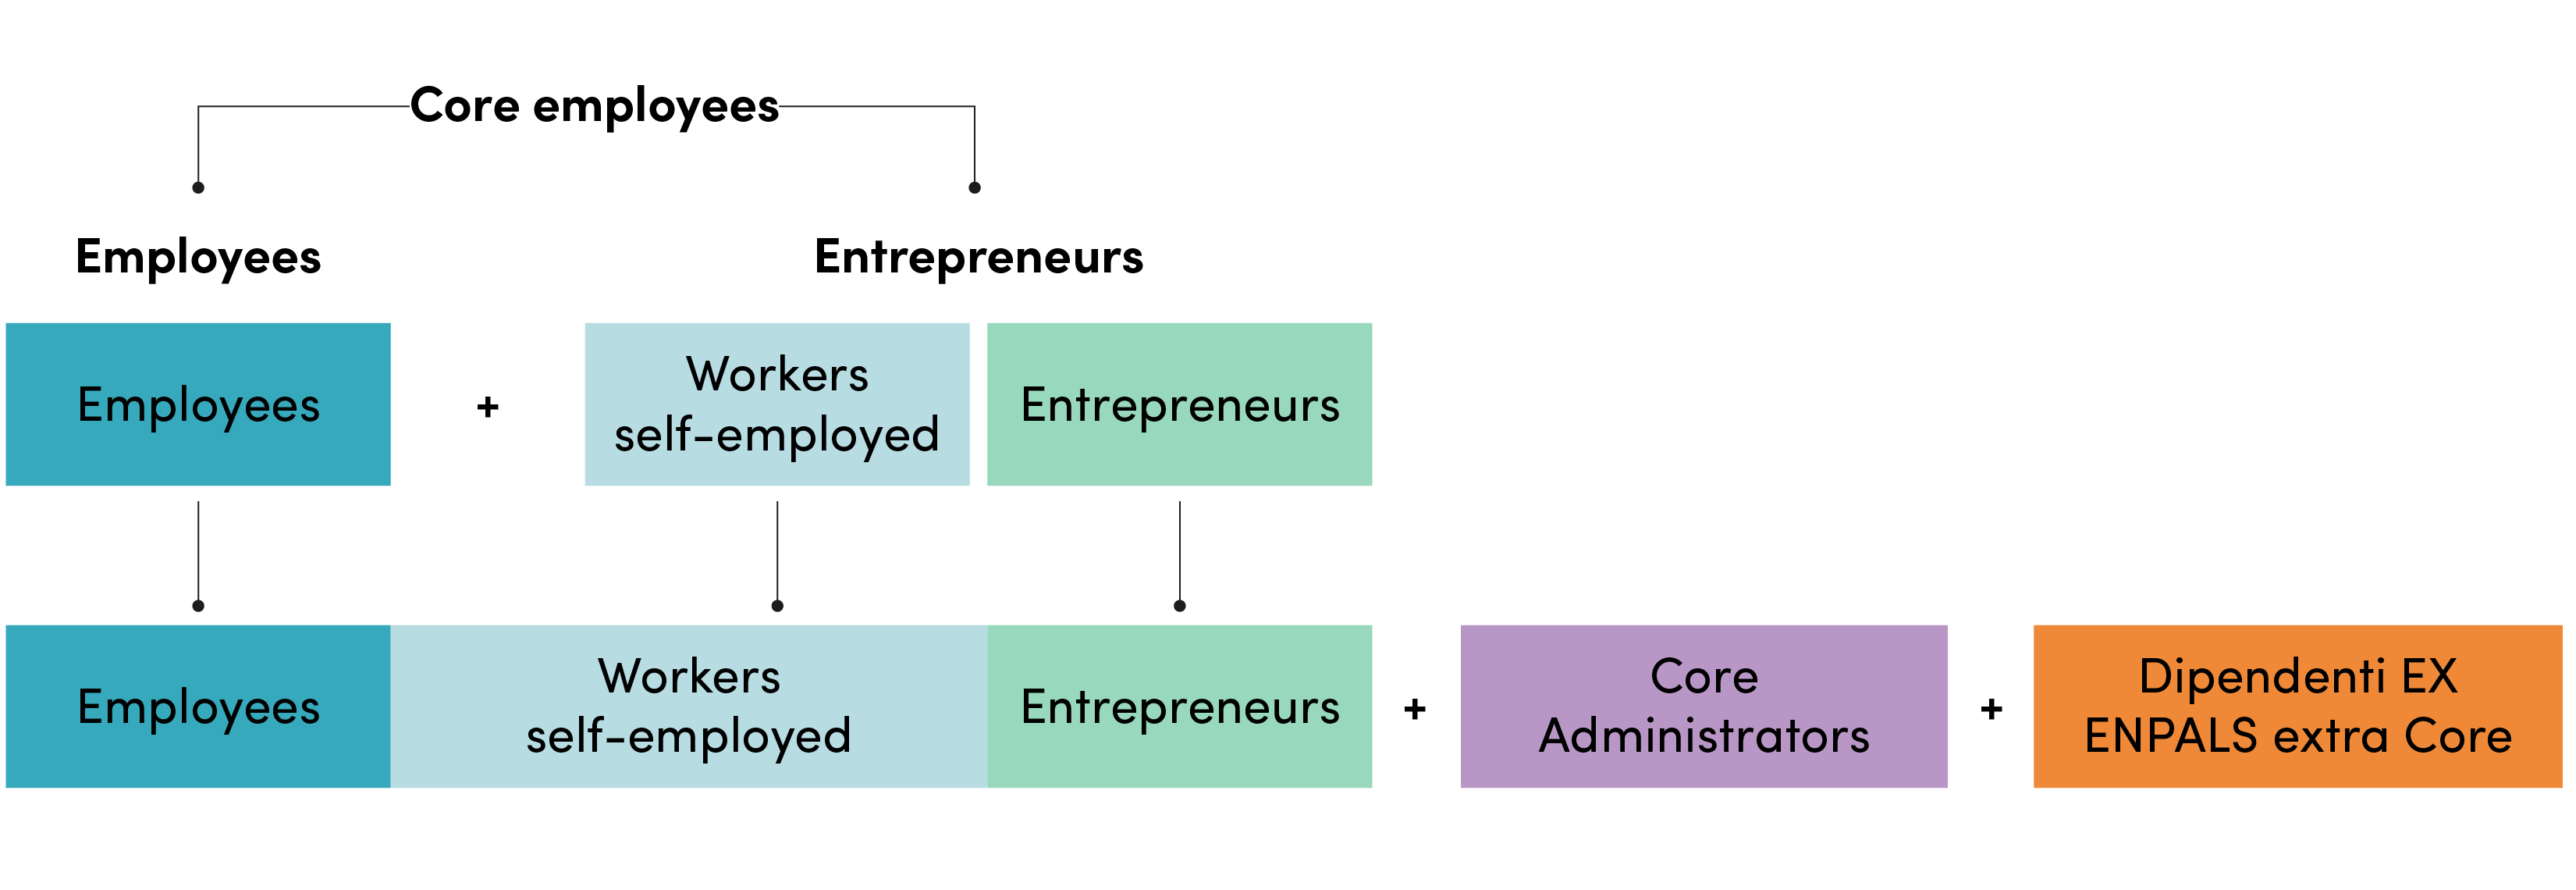
To obtain the number of actual workers, quantified as “head counts,” the dependent and independent units must be transformed into a number of full-time workers, and other subjects should be added to this count, belonging to categories not accounted for, as for Managing Directors.
Specifically, the calculation process requires a breakdown and integration of the employed data following a different path depending on the categories concerned.
The overall direct employment of the audiovisual system underwent a downsizing in the years of the pandemic crisis: in 2020, the reduction was -7.7%, and the increase (+1.9%) in 2021 was not sufficient, if not minimally, to recover the loss recorded: the comparison between 2021 and 2019 thus returns a negative value: -6.0%.
Employed workers in the audiovisual system over the 2018-2021 period
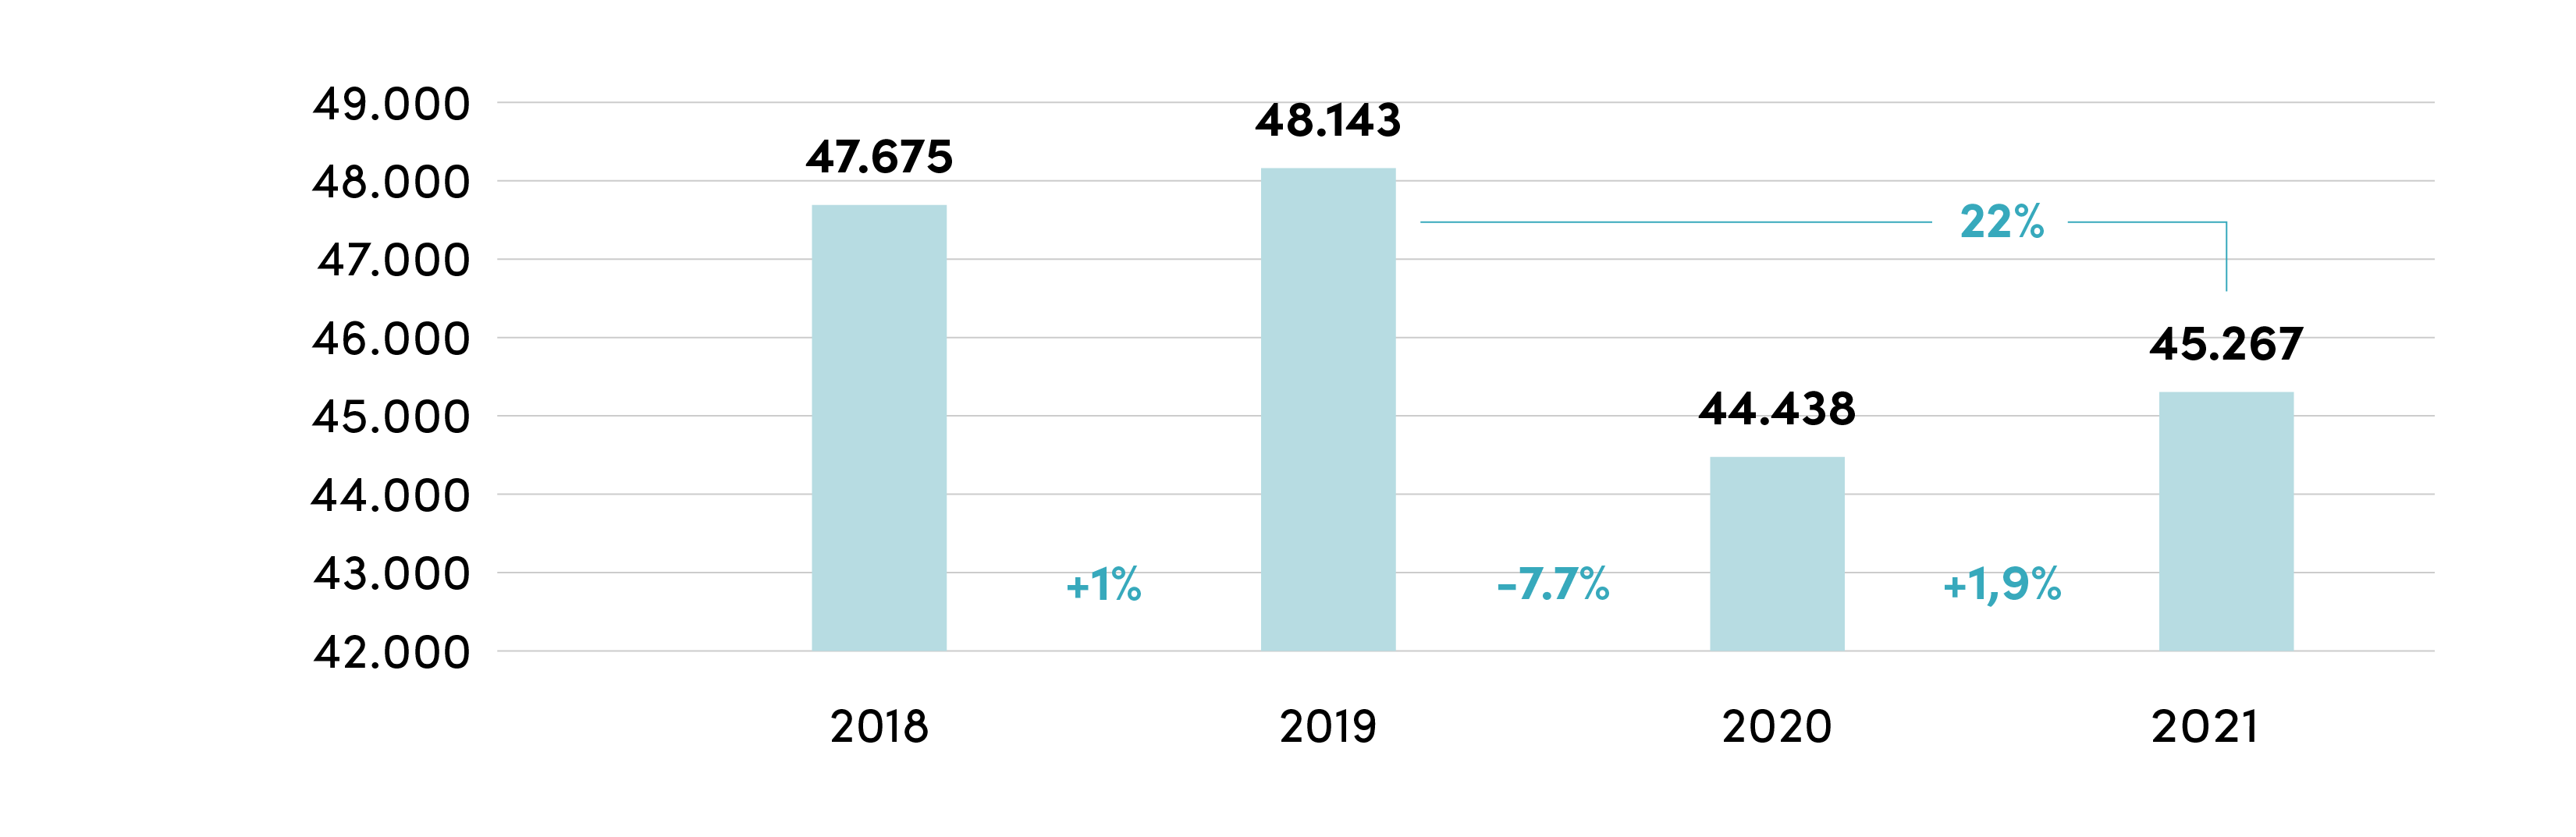
Source: Symbola Foundation
By starting from the employee count within the core’s perimeter, it is possible to trace the data to head counts for the Years 2019 and 2021 (keeping in mind part-time contracts) by passing through Istat coefficients for ATECO (referring to all employees), taking into account the work-unit/job-position ratio [7].
Source: Symbola Foundation
As a consequence, this aggregate expands to 44,075 employees in terms of head counts. However, additional 3,488 employees traced back to head counts must be added to the above count, based on Istat data (ratio of work units/job positions) of workers operating in companies not belonging to the core perimeter but contracted as former ENPALS workers (the former social security institution for audiovisual workers) and classified as workers within the five ATECO categories of the audiovisual core perimeter from the viewpoint of employment.
Among independent workers, there are self-employed workers with a high number of head counts, especially with reference to some professions (actors, for example), for which employment takes place for limited periods of the year and is discontinuous or even sporadic. In this case, one AUW (annual work unit) corresponds to many workers, and this data can be supplied by the social security institution INPS, formerly Enpals (Osservatorio Gestione Lavoratori dello spettacolo e sportivi professionisti), which integrates self-employed workers with additional units and allows to find the average number of paid days over the year for each ATECO code and profession, and therefore define the head count. Based on all these factors, the final count of self-employed workers expressed in head counts is 47,014.
111,235 individuals involved in the audiovisual business
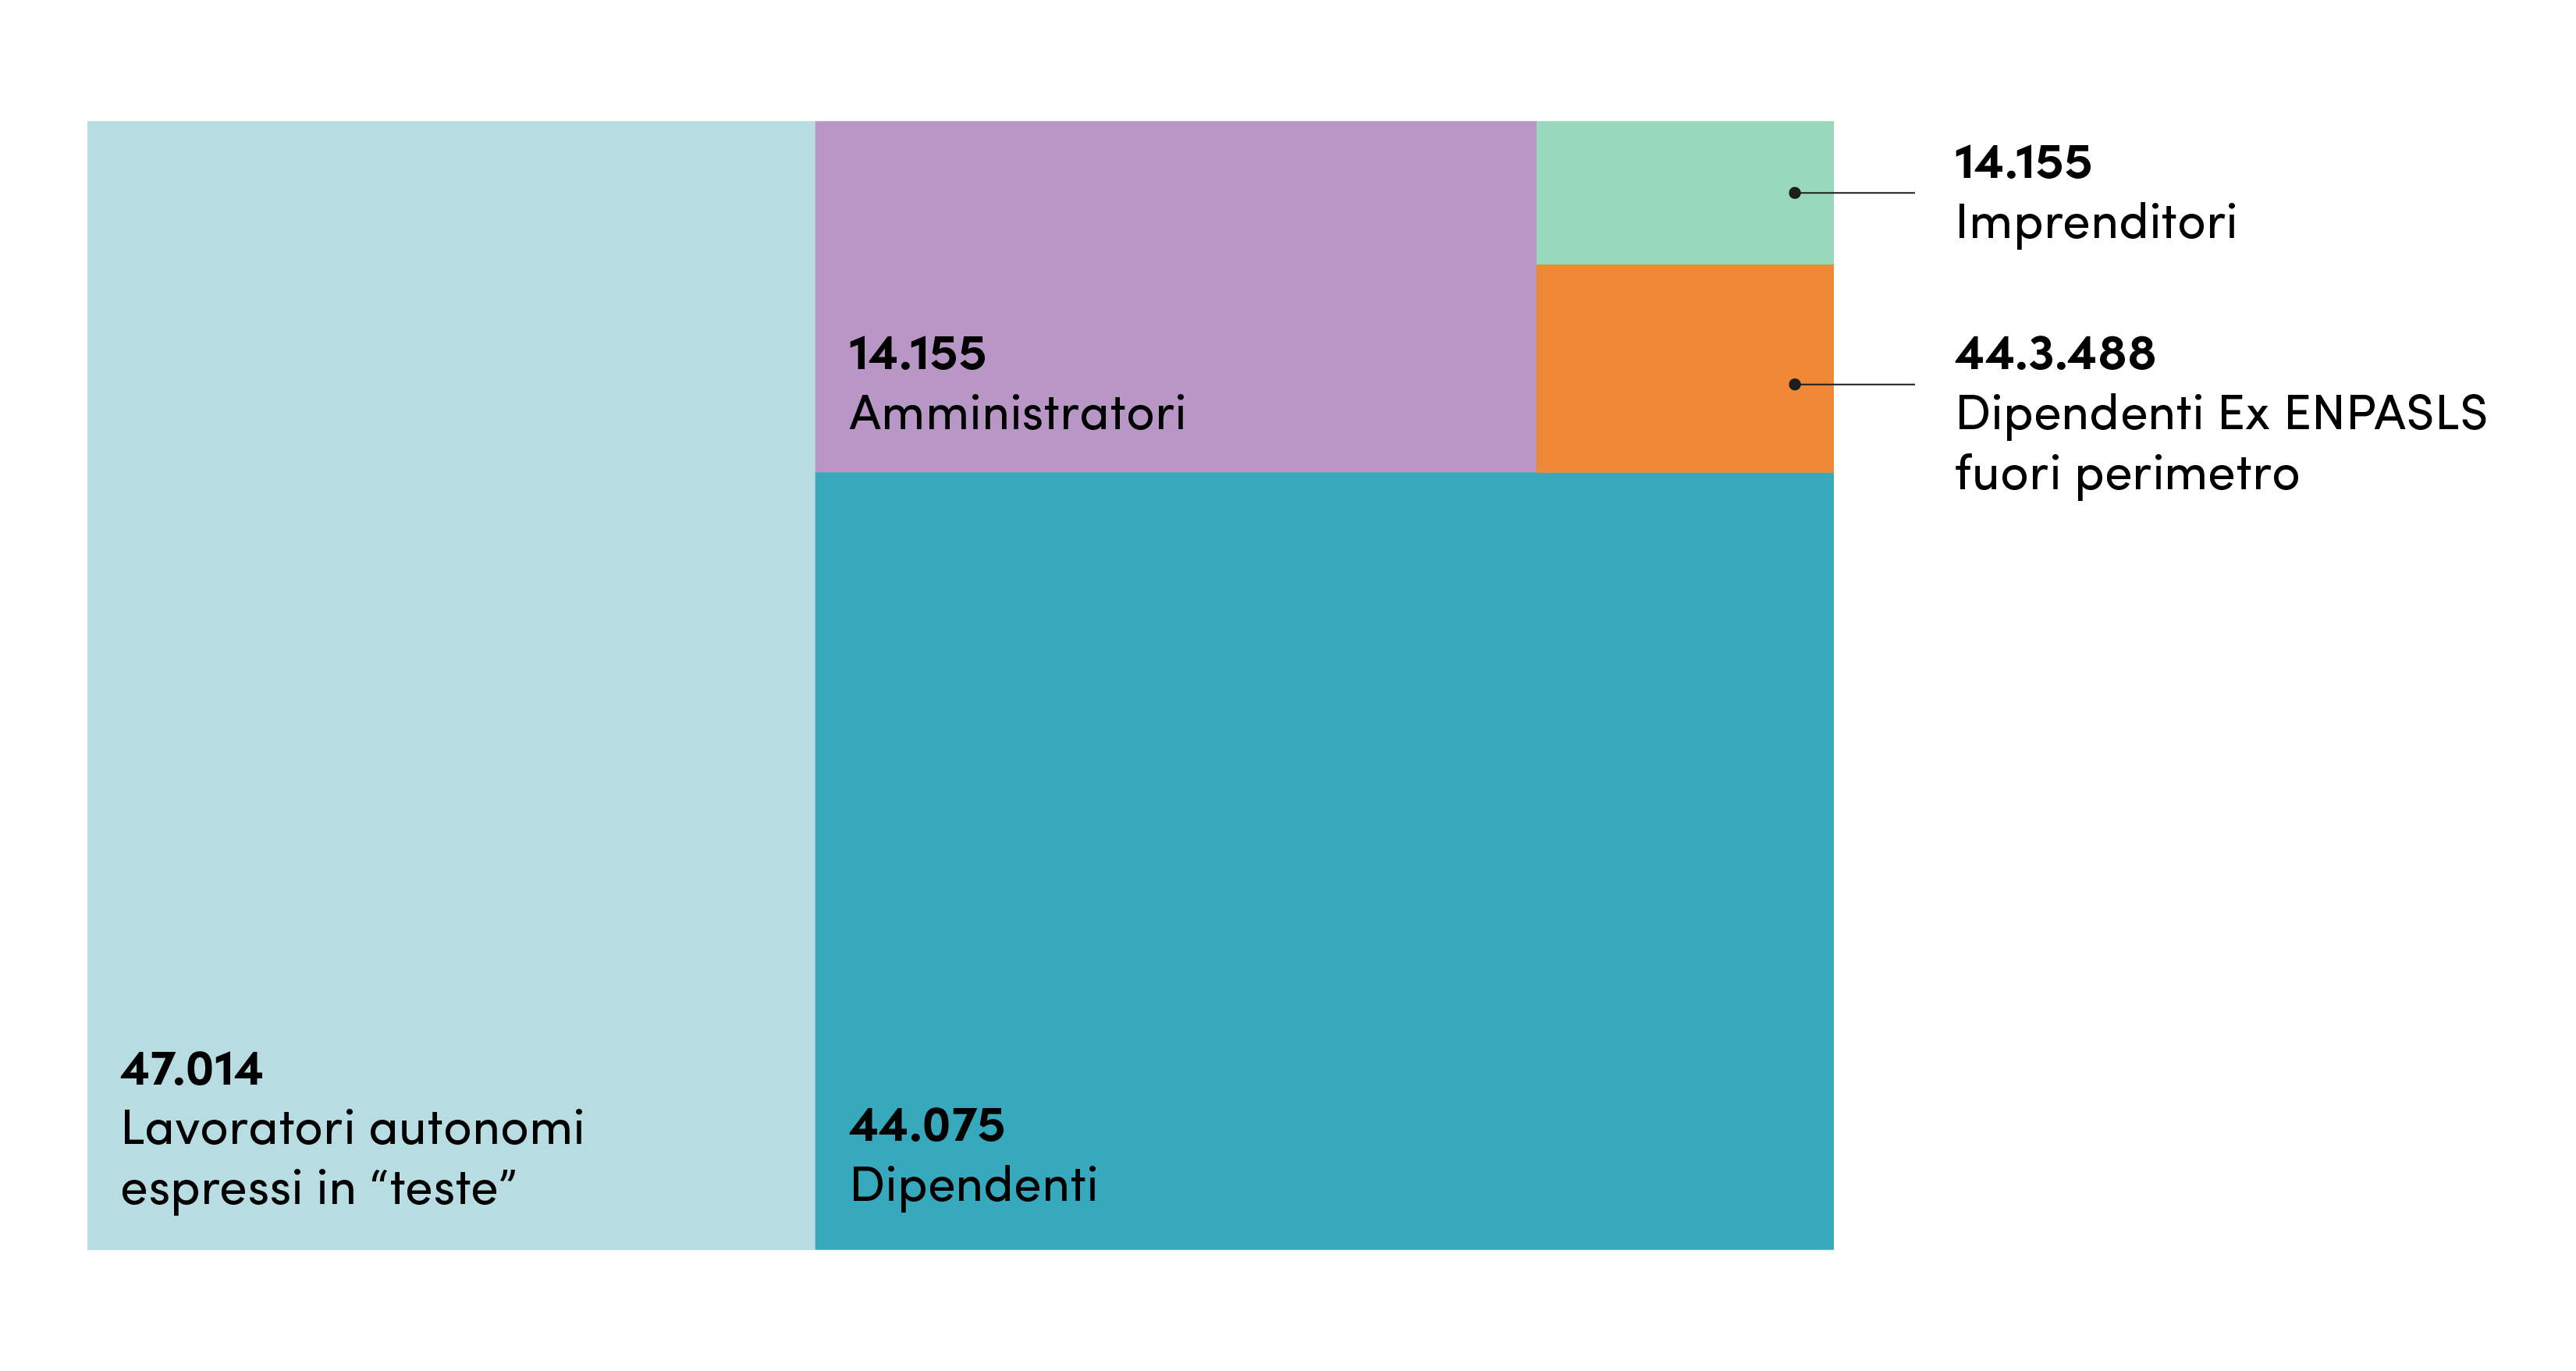
Source: Symbola Foundation elaborations on fonti Istat, Inps, former Enpals and Infocamere data
Besides the above figure, 2,502 businessmen and 14,155 managing directors operating within the selected ATECO codes should be added (non-entrepreneurs, already included among the independent employees), counted once only since their offices can be multiple.
This completes the picture of 111,235 people involved in the overall audiovisual system.
The chronological variation of this reconstruction carried out for the Years 2019 and 2021 shows a substantial drop over the two-year period. In 2019 the total number of people involved was 122,024, and in 2021, 111,235 – meaning an overall reduction of 8.8%.
The variation for the Years 2019 and 2021 reflects a strong cut: the greatest contraction of -8.8% was recorded among self-employed workers (-13.3%), followed by entrepreneurs, strongly discouraged during the pandemic season (-9.8%). The employee decrease was 6.0% for the core perimeter and 5.2% for the former Enpal workers outside the perimeter. In the case of Managing Directors, the changes were more contained (-2.3%).
Breakdown of job positions in view of computing the overall audiovisual employment in terms of head counts for 2019 and 2021
| 2019 | 2021 | ||||
| Position | Description | AUW | Head counts | AUW | Head counts |
| Employed | Employees of companies within the audiovisual core perimeter. Data computed as head counts on Istat data (working unit/job positions ratio.) | 40,676 | 46,876 | 38,246 | 44,075 |
| Self-employed workers | Self-employed workers computed as single individuals on former Enpal/Inps data (Osservatorio Gestione Lavoratori dello spettacolo e sportivi professionisti) according to paid days/year, integrated with self-employed workers count retrieved by former Enpal data. | 9,752 | 54,203 | 8,544 | 47,014 |
| Entrepreneurs | Data computed on the Business Register within the audiovisual coreperimeter (Infocamere) | 2,774 | 2,774 | 2,502 | 2,502 |
| Managing Directors | Data computed on the Business Register with specific reference to head counts and not positions within the audiovisual core perimeter (Infocamere) | 14,491 | 14,155 | ||
| Former Enpal employees outside the core perimeter | Employees of companies not belonging to the audiovisual core perimeter but under former Enpal contracts and classified as workers within the five economic classes of Ateco. Data computed on head counts on Istat data (working unit/job positions rapport) | 3,193 | 3,680 | 3,027 | 3,488 |
| TOTAL | 122,024 | 111.235 |
Source: Symbola Foundation elaboration on Istat, Inps, former Enpals, and Infocamere data
2019-2021 variation of people working in the audiovisual system.
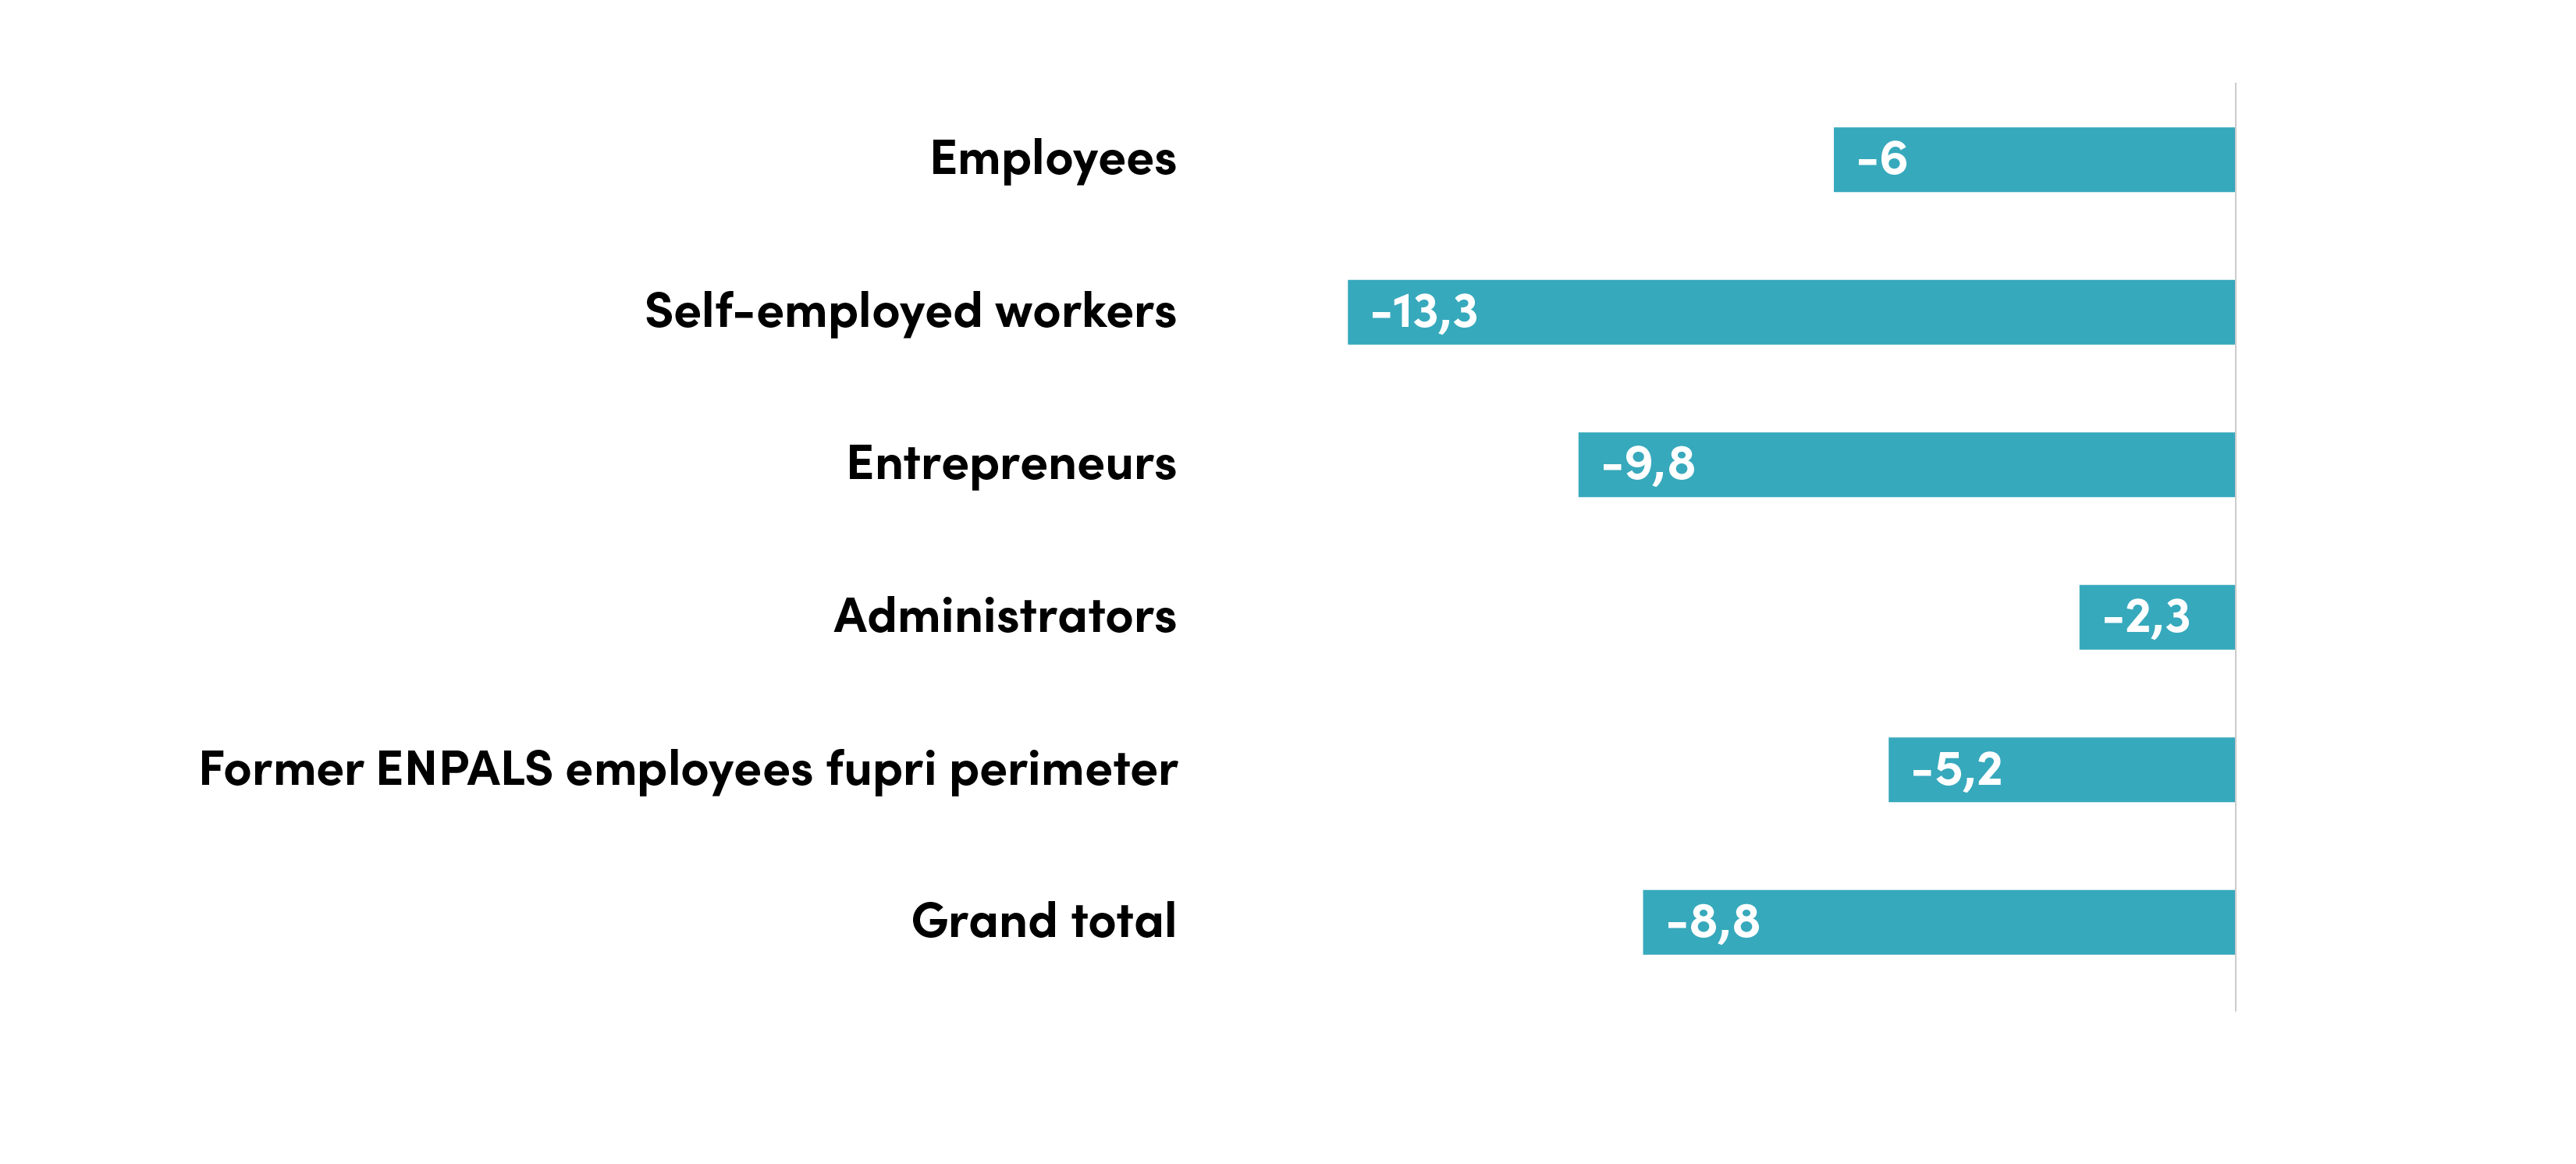
Source: Symbola Foundation elaboration on Istat, Inps, former Enpals and Infocamere data