The Entrepreneurial System of the Audiovisual Supply Chain
Following the recovery in 2021, driven by the gradual normalization of economic activity and an increase in demand for audiovisual content, 2022 witnessed significant consolidation in the audiovisual supply chain. The latter comprises a total of 8,601 companies, representing 4.8% growth compared to the previous year, an absolute increase of nearly 400 new companies operating in the sector. At the same time, the number of employees reached 52,845, an increase of 3.2%, corresponding to an absolute increase of well over 1,600 units. These figures confirm the positive trend in the sector, which benefits from growing demand for original productions, the expansion of streaming platforms, and the strengthening of public support policies for the cultural and creative industries.
Active companies and employees in the audiovisual supply chain* by sectors
Year 2022 (absolute values and %)
| Sectors | Active companies | % | Company employees | % | |
| 5911 | Theatrical, video & TV production activities | 5,435 | 63.2 | 21,615 | 40.9 |
| 5912 | Theatrical, video & TV post-production activities | 1,572 | 18.3 | 3,037 | 5.7 |
| 5913 | Theatrical, video & TV distribution activities* | 230 | 2.7 | 1,929 | 3.6 |
| 5914 | Exhibition activities | 655 | 7.6 | 4,553 | 8.6 |
| 6020 | TV programming & broadcasting activities* | 709 | 8.2 | 21,711 | 41.1 |
| TOTAL AUDIOVISUAL CORE | 8,601 | 100.0 | 52,845 | 100.0 |
*All data include Rai – Radiotelevisione italiana S.p.a. and Istituto Luce-Cinecittà for equal comparison, although classified as Public Offices and therefore not included in the Business Register.
Source: Symbola Foundation elaborations on Istat data
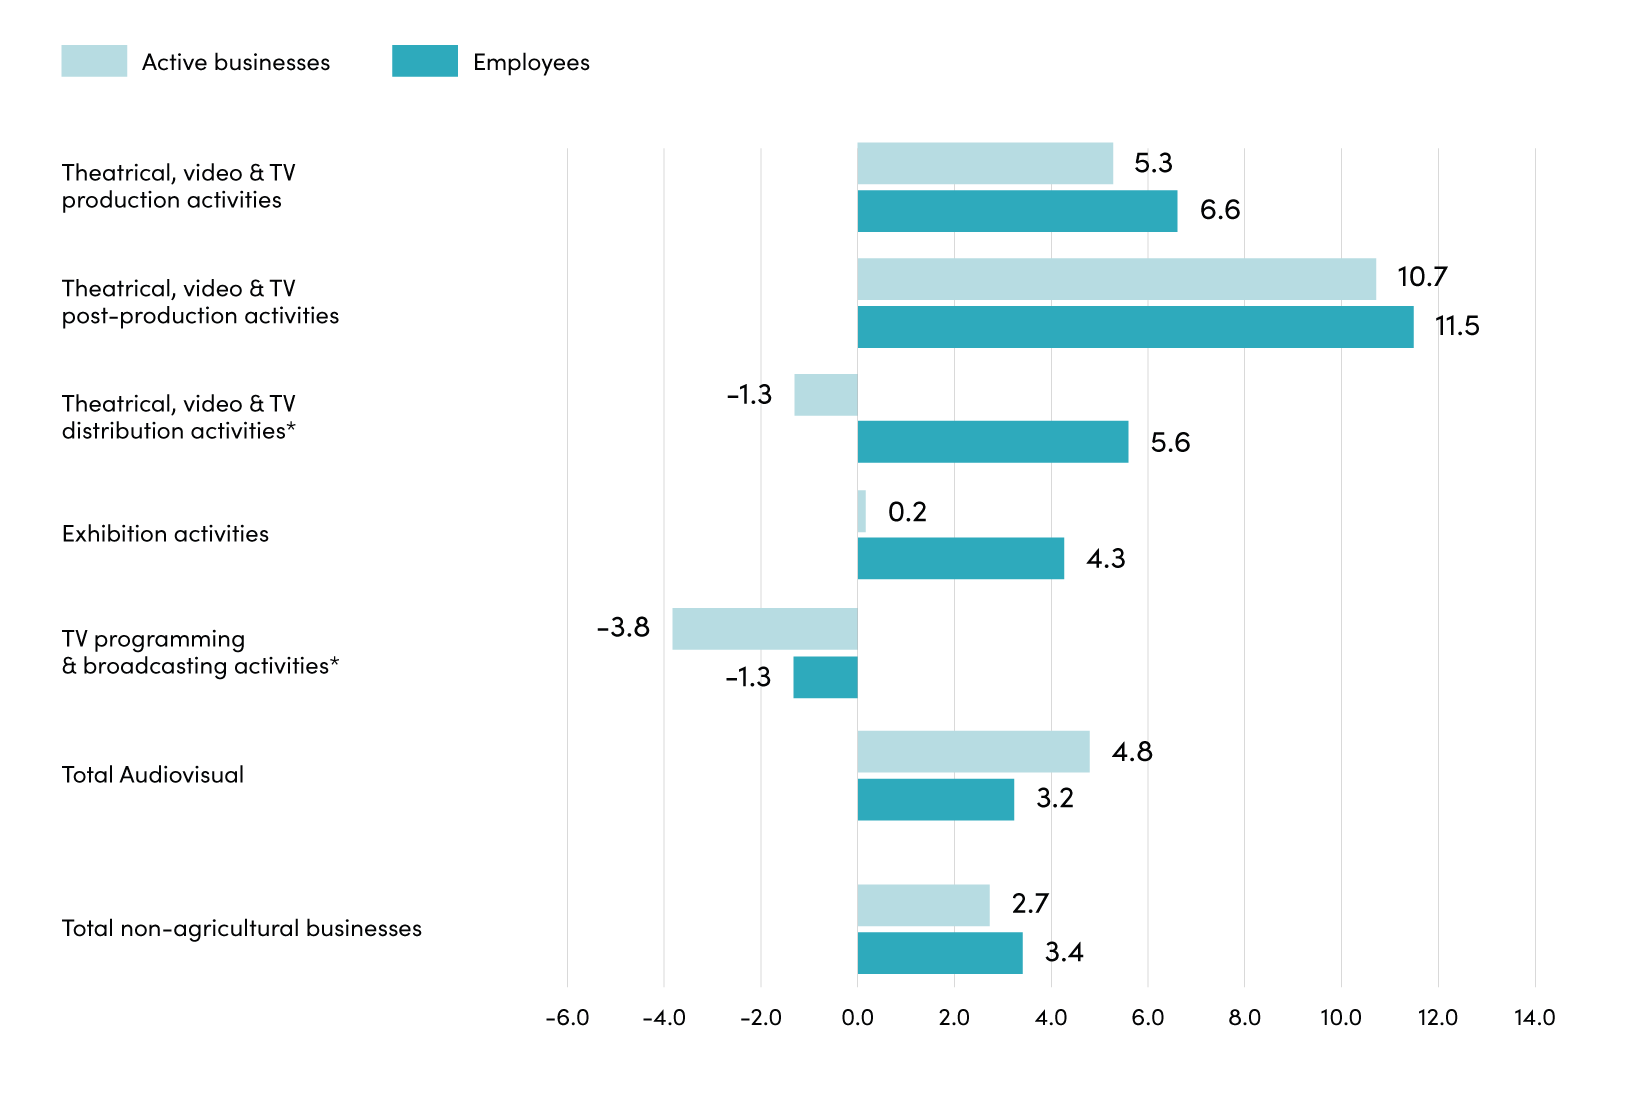
In terms of business volume, 2022 growth mainly concerned theatrical, video & TV post-production companies (Ateco 5912, +10.7%) and theatrical, video & TV production companies (Ateco 5911, +5.3%), whereas the hemorrhage of companies in exhibition activities halted, remaining substantially stable (Ateco 5914, +0.2%). Theatrical, video & TV distribution companies suffered a slight decline (Ateco 5913, -1.3%), while the decrease in TV programming & broadcasting companies was more substantial (Ateco 6020, -3.8%).
Breakdown of active businesses and employees in the audiovisual supply chain* by sectors
Years 2022/2021 (% variation)
*All data include Rai – Radiotelevisione italiana S.p.a. and Istituto Luce-Cinecittà for equal comparison, although classified as Public Offices and therefore not included in the Business Register.
Source: Symbola Foundation elaborations on Istat data
The employment data confirms significant growth in theatrical, video & TV post-production activities (+11.5%) and highlights the positive growth in theatrical, video & TV production activities (+6.6%, corresponding to more than 1,300 additional employees). While TV programming & broadcasting experienced a corresponding drop in employment (-1.3%), the reduction in theatrical, video & TV distribution volume was offset by an increase in employment (+5.6%), a circumstance also assessed within exhibition activities (+4.3%). Based on the combined arrangement of these variations, in the latter two sectors, the average company size increased from 7.8 to 8.4 for Ateco 5913 (distribution) and from 6.7 to 7.0 for Ateco 5914 (exhibition).
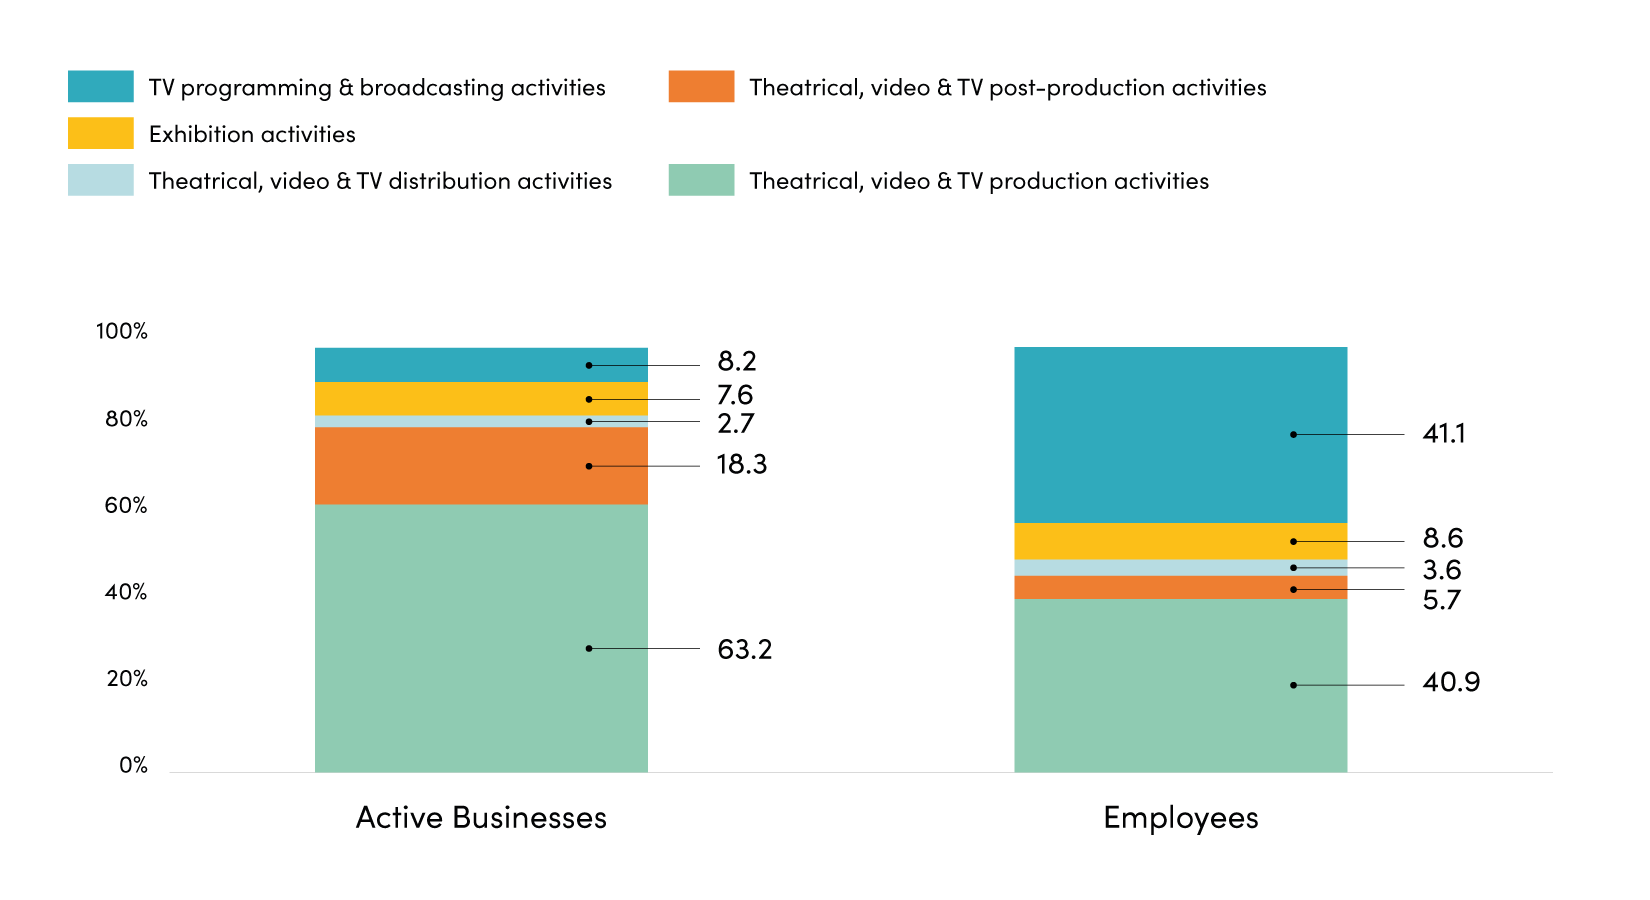
63.2% of companies active in the audiovisual supply chain operate in production, totaling 5,435 units, followed by post-production, represented by 1,572 companies (18.3%). Exhibition is stable with 655 units (7.6%), while TV programming & broadcasting decreased to 709 companies (8.2%). Finally, theatrical, video & TV distribution companies comprise 230 units, representing 2.7% of the sector.
In the employment sector, there are a total of 52,845 employees, with TV programming & broadcasting accounting for 41.1% (down from 43.0% in the previous year). Stable shares are recorded for theatrical, video & TV distribution activities and for exhibition activities (3.6% and 8.6% respectively), while there was an increasing incidence for post-production (5.7%, the previous year was 5.3%) and above all for theatrical, video & TV production activities (40.9%, in 2021 it was 39.6%).
Distribution of active companies and employees in the audiovisual supply chain* by sectors
Years 2022 (%)
*All data include Rai – Radiotelevisione italiana S.p.a. and Istituto Luce-Cinecittà for equal comparison, although classified as Public Offices and therefore not included in the Business Register.
Source: Symbola Foundation elaborations on Istat data
Compared to the previous year, company size data present different variations: despite the +4.8% recorded on average, large companies decreased by -9.1% (compared to the growth figure recorded in the previous report), in favor of a growth in medium-sized companies (+13.5%). Small businesses have decreased as well (-1.8%), while micro businesses are growing (+5.1%).
The growth of micro-enterprises was primarily attributed to the production sector (+5.7%, corresponding to a positive balance of 280 units) and to post-production (+10.6%, 146 units). Small businesses also grew in the post-production sector (+12.8%) and in distribution (+16.7%), while medium-sized companies recorded an increase in production activities (+14.0%).
These results have influenced the business composition in the supply chain from a dimensional point of view: 93.7% of the supply chain is made up of micro enterprises (up to 9 employees, the share has slightly grown compared to the previous year), 5.1% are small (from 10 to 49 employees, down compared to 2021), 1.0% are medium (from 50 to 249 employees, a slightly increasing share) and 0.2% are large (250 employees and more, share decreasing).
The weight of micro-enterprises is relatively higher in theatrical, video & TV post-production (96.9%), the share of small companies is higher in TV programming & broadcasting activities (16.6%), medium-sized companies see a greater share in theatrical, video & TV distribution activities (3.5%) and large companies are again more active in TV programming & broadcasting (0.9%).
The employee variation partly reproduces the business scheme. In fact, employment growth is confirmed for micro-enterprises (+3.7%, corresponding to an increase of 413 employees), especially for medium-sized enterprises, which saw a growth rate of +21.5% (+1,570 employees), primarily concentrated in theatrical, video, & TV production activities. The loss of employment in large companies (-3.1%) contrasts with that in small companies, which is positive at +5.2% (+429 employees), indicating dimensional growth within the class.
Breakdown of active businesses in the audiovisual supply chain* by sector and employee class
Year 2022 (absolute value)
| Sectors | up to 9 (micro) | 10-49 (small) | 50-249 (average) | 250 and above (large) | Total | |
| 5911 | Theatrical, video & TV production activities | 5,168 | 199 | 57 | 11 | 5,435 |
| 5912 | Theatrical, video & TV post-production activities | 1,523 | 44 | 5 | – | 1,572 |
| 5913 | Theatrical, video & TV distribution activities* | 206 | 14 | 8 | 2 | 230 |
| 5914 | Exhibition activities | 582 | 65 | 6 | 2 | 655 |
| 6020 | TV programming & broadcasting activities* | 578 | 118 | 8 | 5 | 709 |
| TOTAL AUDIOVISUAL CORES | 8,057 | 448 | 84 | 20 | 8,601 |
Composition %
| Sectors | up to 9 (micro) | 10-49 (small) | 50-249 (average) | 250 and above (large) | Total | |
| 5911 | Theatrical, video & TV production activities | 95.1 | 3.7 | 1.0 | 0.2 | 100.0 |
| 5912 | Theatrical, video & TV post-production activities | 96.9 | 2.8 | 0.3 | 0.0 | 100.0 |
| 5913 | Theatrical, video & TV distribution activities* | 89.6 | 6.1 | 3.5 | 0.9 | 100.0 |
| 5914 | Exhibition activities | 88.9 | 9.9 | 0.9 | 0.3 | 100.0 |
| 6020 | TV programming & broadcasting activities* | 81.5 | 16.6 | 1.1 | 0.7 | 100.0 |
| TOTAL AUDIOVISUAL CORES | 93.7 | 5.1 | 1.0 | 0.2 | 100.0 |
2022/2021 Variation %
| Sectors | up to 9 (micro) | 10-49 (small) | 50-249 (average) | 250 and above (large) | Total | |
| 5911 | Theatrical, video & TV production activities | 5.7 | -6.1 | 14.0 | -15.4 | 5.3 |
| 5912 | Theatrical, video & TV post-production activities | 10.6 | 12.8 | 25.0 | – | 10.7 |
| 5913 | Theatrical, video & TV distribution activities* | -2.8 | 16.7 | 0.0 | 100.0 | -1.3 |
| 5914 | Exhibition activities | 0.9 | -7.1 | 20.0 | 0.0 | 0.2 |
| 6020 | TV programming & broadcasting activities* | -5.1 | 2.6 | 14.3 | -16.7 | -3.8 |
| TOTAL AUDIOVISUAL CORES | 5.1 | -1.8 | 13.5 | -9.1 | 4.8 |
*All data include Rai – Radiotelevisione italiana S.p.a. and Istituto Luce-Cinecittà for equal comparison, although classified as Public Offices and therefore not included in the Business Register.
Source: Symbola Foundation elaborations on Istat data
Breakdown of audiovisual supply chain employees* by sector and employee class
Year 2022 (absolute values)
| Sectors | up to 9 (micro) | 10-49 (small) | 50-249 (average) | 250 and above (large) | Total | |
| 5911 | Theatrical, video & TV production activities | 6,651 | 4,060 | 6,552 | 4,352 | 21,615 |
| 5912 | Theatrical, video & TV post-production activities | 1,920 | 799 | 318 | 0 | 3,037 |
| 5913 | Theatrical, video & TV distribution activities* | 356 | 206 | 762 | 604 | 1,929 |
| 5914 | Exhibition activities | 1,656 | 1,168 | 469 | 1,259 | 4,553 |
| 6020 | TV programming & broadcasting activities* | 1,010 | 2,487 | 759 | 17,454 | 21,711 |
| TOTAL AUDIOVISUAL CORES | 11,595 | 8,720 | 8,861 | 23,670 | 52,845 |
Composition %
| Sectors | up to 9 (micro) | 10-49 (small) | 50-249 (average) | 250 and above (large) | Total | |
| 5911 | Theatrical, video & TV production activities | 30.8 | 18.8 | 30.3 | 20.1 | 100.0 |
| 5912 | Theatrical, video & TV post-production activities | 63.2 | 26.3 | 10.5 | 0.0 | 100.0 |
| 5913 | Theatrical, video & TV distribution activities* | 18.5 | 10.7 | 39.5 | 31.3 | 100.0 |
| 5914 | Exhibition activities | 36.4 | 25.7 | 10.3 | 27.7 | 100.0 |
| 6020 | TV programming & broadcasting activities* | 4.7 | 11.5 | 3.5 | 80.4 | 100.0 |
| TOTAL AUDIOVISUAL CORES | 21.9 | 16.5 | 16.8 | 44.8 | 100.0 |
2022/2021 Variation %
| Sectors | up to 9 (micro) | 10-49 (small) | 50-249 (average) | 250 and above (large) | Total | |
| 5911 | Theatrical, video & TV production activities | 7.2 | 4.2 | 30.1 | -15.3 | 6.6 |
| 5912 | Theatrical, video & TV post-production activities | 7.8 | 20.7 | 13.3 | – | 11.5 |
| 5913 | Theatrical, video & TV distribution activities* | -6.5 | -14.0 | -17.3 | 112.8 | 5.6 |
| 5914 | Exhibition activities | -5.3 | -0.9 | 35.3 | 15.4 | 4.3 |
| 6020 | TV programming & broadcasting activities* | -5.3 | 7.4 | 7.7 | -2.6 | -1.3 |
| TOTAL AUDIOVISUAL CORES | 3.7 | 5.2 | 21.5 | -3.1 | 3.2 |
*All data include Rai – Radiotelevisione italiana S.p.a. and Istituto Luce-Cinecittà for equal comparison, although classified as Public Offices and therefore not included in the Business Register.
Source: Symbola Foundation elaborations on Istat data
As a consequence of the dynamics illustrated, 44.8% of employees are concentrated in large companies to a lesser extent than in 2021 (when the share was 47.7%), 21.9% are in micro companies (the previous year it was 21.8%), 16.8% in medium-sized companies (a growing value: in 2021 it was 14.2%) and 16.5% in small companies (previous year: 16.2%).
In post-production, 63.2% of employees are in micro-enterprises, and at the same time, in small ones (26.3%), previously more active in exhibition activities. In theatrical, video & TV distribution, 39.5% of employees work in medium-sized companies (a significant decrease from 50.5% in 2021). Conversely, for TV programming and broadcasting, the concentration of employees in large companies remains largely predominant (80.4%).