The entrepreneurial system of the audiovisual supply chain
Exiting the peak year of the pandemic crisis, a significant recovery in the film and television supply chain has taken place, and, according to the latest available Istat data retrieved from the Statistical Archive of Active Businesses for 2021, it counts 8,207 businesses, having grown by +8.6% since 2020, more than three times all non-agricultural companies (+2.6%). In detail, the industry has grown by 652 companies, resulting in a difference between 1,380 new and 738 terminated businesses.
Breakdown of active businesses and employees in the audiovisual supply chain* by production sectors
Year 2021 (absolute value)
| Sectors | Active Businesses | % | Employees | % | |
| 5911 | Theatrical, video & TV production activities | 5.163 | 62,9 | 20.275 | 39,6 |
| 5912 | Theatrical, video & TV post-production activities | 1.420 | 17,3 | 2.724 | 5,3 |
| 5913 | Theatrical, video & TV distribution activities* | 233 | 2,8 | 1.826 | 3,6 |
| 5914 | Exhibition activities | 654 | 8,0 | 4.366 | 8,5 |
| 6020 | TV programming & broadcasting activities* | 737 | 9,0 | 22.002 | 43,0 |
| TOTAL AUDIOVISUAL CORE | 8.207 | 100,0 | 51.194 | 100,0 |
* All data include Rai – Radiotelevisione italiana S.p.a. and Istituto Luce-Cinecittà for equal comparison, although not classified as Public Offices and therefore not included in the Business Register.
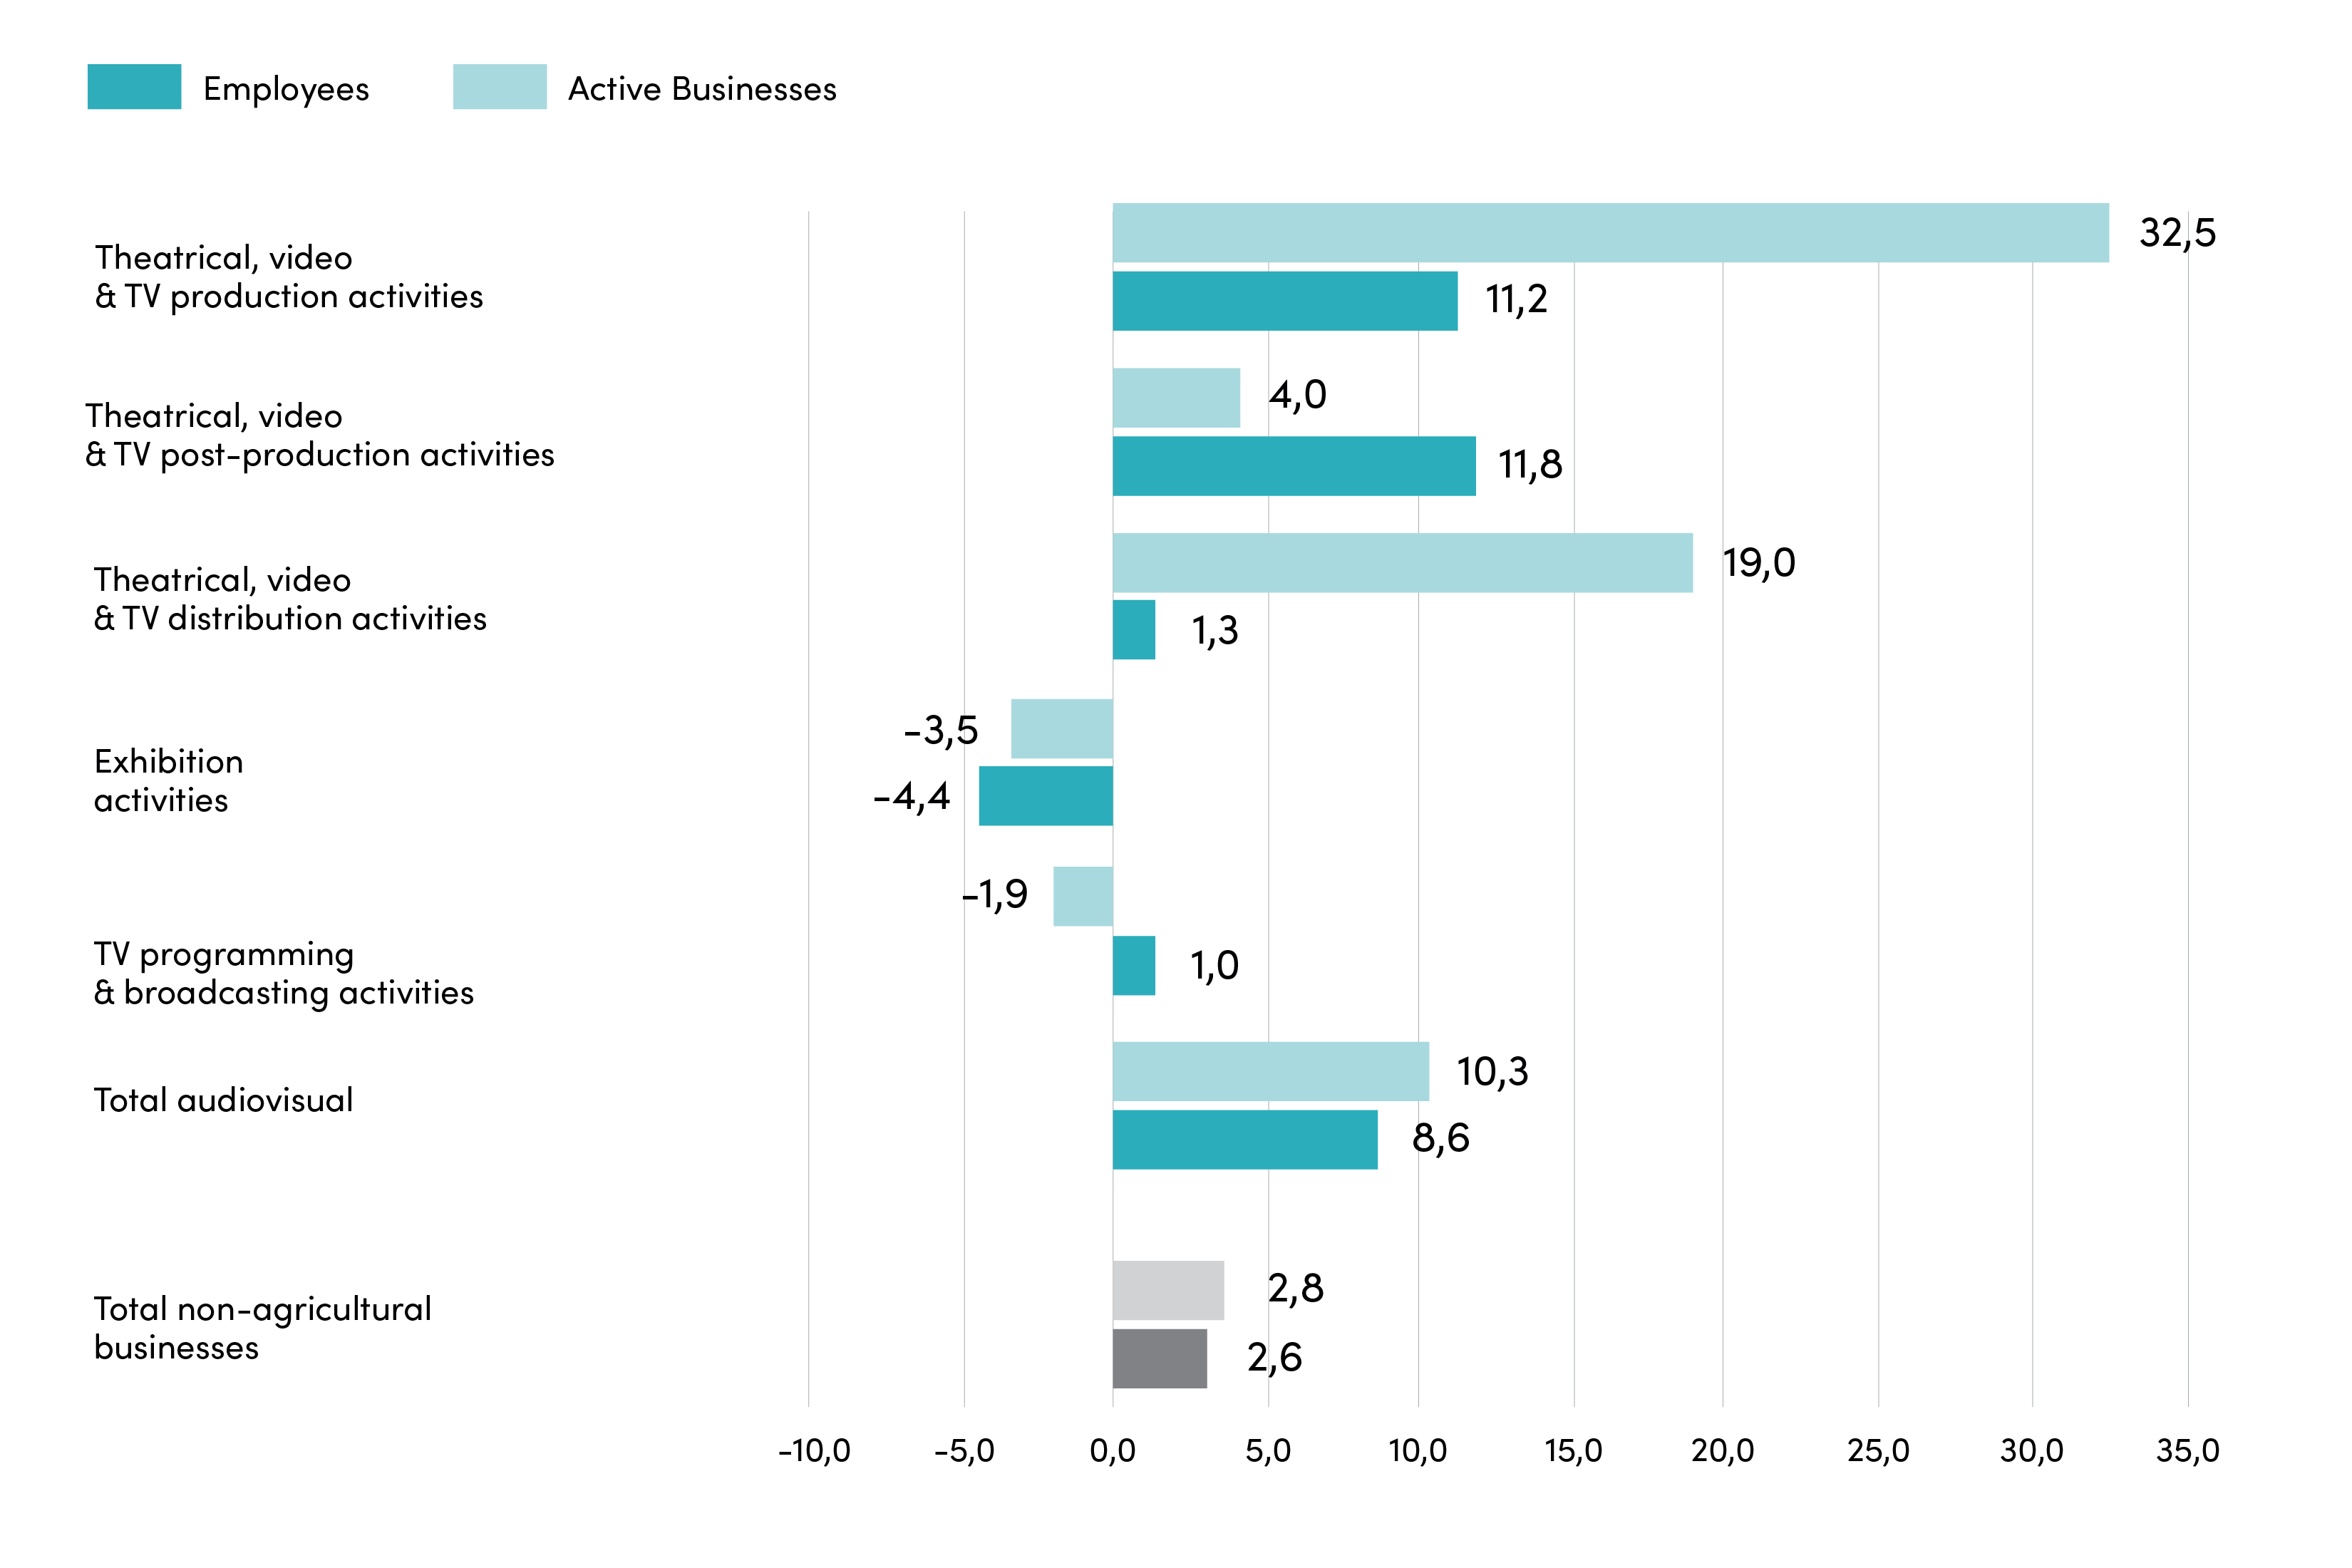
In terms of business volume, the 2021 growth mainly concerned theatrical, video & TV production activities (Ateco 5911, +11.2%) and theatrical, video & TV post-production activities (Ateco 5912, +11.8%), whereas distribution (5913), and TV programming & broadcasting activities (6020) witnessed a more modest increase (respectively +1.3% and +1.0%); on the other hand, exhibition pursued its downward trend (-4.4%).
As for employment, the figures for theatrical, video & TV production (almost 5,000 employees, +32.5%) are even more heightened thanks to the entry of new companies (over 1,400 additional employees) and to the growth of existing ones (nearly +3,600). As a result, the average size of the sector growth goes from 3.3 to 3.9 headcounts per company.
The dynamics of active businesses and employees in the audiovisual supply chain* by production sectors
Years 2021/2020 (percentage variation)
* All data include Rai – Radiotelevisione italiana S.p.a. and Istituto Luce-Cinecittà for equal comparison, although not classified as Public Offices and therefore not included in the Business Register.
For post-production, the volume growth did not mirror the employment increase (although interseasonal still marks a +4.0%), while in the case of theatrical, video & TV shows distribution, the modest interseasonal growth was accompanied by a significant increase in employment equal to +19.0% (nearly 300 more employees than in 2020).
The distribution of active businesses and workers shows that 62.9% of companies operate in theatrical and/or television production (5,163 units), followed by post-production (1,420, 17.3%). Exhibitions have further dropped to 654 units (8.0%), while TV programming is stable at 737 companies (9.0%), and distribution counts 233 units for a 2.8% share of the system.
Distribution of active companies and employees in the audiovisual supply chain* by production sector
Year 2021 (by percentage)

* All data include Rai – Radiotelevisione italiana S.p.a. and Istituto Luce-Cinecittà for equal comparison, although not classified as Public Offices and therefore not included in the Business Register.
There are 51,194 employees in total, with the share of theatrical and television production falling to 33.0%, post-production to 5.6%, television programming rising to 48.3%, and theatrical employment sharply dropping to 9.7%.
Compared to 2020, class size data have increased mainly within medium and large companies (respectively +23.3%, +14 companies, and +37.5%, +6 companies). From the point of view of distribution, 93.4% of the supply chain is made up of micro-companies (up to 9 employees), 5.5% are small (from 10 to 49 employees), 0.9% are medium (from 50 to 249 employees), and 0.3% are large companies (250 employees and over).
In terms of incidence, the weight of micro-enterprises is relatively higher in theatrical, video & TV post-production (97.0%), the share of small enterprises is higher in TV programming & broadcasting activities (15.6%), medium enterprises have a higher share in theatrical, video & TV distribution activities (3.4%) and large enterprises are always more present in TV programming & broadcasting activities (0.8%).
Medium and large enterprises have mainly grown in production activities (the absolute balance is +18 units), which also recorded a growth of micro-enterprises (+10.3%, +458 units), just as in post-production (+12.3%, +151 units). Exhibition has lost -4.6% (-28 units), and micro and medium businesses -28.6% (-2 units). Small enterprises declined in TV programming & broadcasting activities (-7.3%, corresponding to a loss of 9 units).
In terms of employees, medium and large enterprises continue growing, +22.0% and +14.0%, respectively, which corresponds to 1,314 and 2,994 more employees than in 2020.
Breakdown of active businesses in the audiovisual supply chain* by production sectors by employee class
Year 20201(absolute value)
| Sectors | up to 9 (micro) | 10-49 (small) | 50-249 (medium) | 250 & + (majors) | Total | |
| 5911 | Theatrical, video & TV production activities | 4.888 | 212 | 50 | 13 | 5.163 |
| 5912 | Theatrical, video & TV post-production activities | 1.377 | 39 | 4 | – | 1.420 |
| 5913 | Theatrical, video & TV distribution activities* | 212 | 12 | 8 | 1 | 233 |
| 5914 | Exhibition activities | 577 | 70 | 5 | 2 | 654 |
| 6020 | TV programming & broadcasting activities* | 609 | 115 | 7 | 6 | 737 |
| TOTAL AUDIOVISUAL | 7.663 | 448 | 74 | 22 | 8.207 |
Percentage %
| Sectors | up to 9 (micro) | 10-49 (small) | 50-249 (medium) | 250 & +(majors) | Total | |
| 5911 | Theatrical, video & TV production activities | 94,5 | 4,1 | 1,0 | 0,3 | 100,0 |
| 5912 | Theatrical, video & TV post-production activities | 97,0 | 2,7 | 0,3 | – | 100,0 |
| 5913 | Theatrical, video & TV distribution activities* | 91,0 | 5,2 | 3,4 | 0,4 | 100,0 |
| 5914 | Exhibition activities | 88,2 | 10,7 | 0,8 | 0,3 | 100,0 |
| 6020 | TV programming & broadcasting activities* | 82,6 | 15,6 | 0,9 | 0,8 | 100,0 |
| TOTAL AUDIOVISUAL | 93,4 | 5,5 | 0,9 | 0,3 | 100,0 |
Interseasonal % 2021/2020
| Sectors | up to 9 (micro) | 10-49 (small) | 50-249 (medium) | 250 & +(majors) | Total | |
| 5911 | Theatrical, video & TV production activities | 10,3 | 27,7 | 28,2 | 116,7 | 11,2 |
| 5912 | Theatrical, video & TV post-production activities | 12,3 | -4,9 | 100,0 | -100,0 | 11,8 |
| 5913 | Theatrical, video & TV distribution activities* | 1,0 | -7,7 | 33,3 | – | 1,3 |
| 5914 | Exhibition activities | -4,6 | – | -28,6 | – | -4,4 |
| 6020 | TV programming & broadcasting activities* | 2,5 | -7,3 | 16,7 | – | 1,0 |
| TOTAL AUDIOVISUAL | 8,5 | 8,2 | 23,3 | 37,5 | 8,6 |
* All data include Rai – Radiotelevisione italiana S.p.a. and Istituto Luce-Cinecittà for equal comparison, although not classified as Public Offices and therefore not included in the Business Register.
Breakdown of audiovisual supply chain employees* by production sectors by employee classes
Year 2021 (absolute value)
| Sectors | up to 9 (micro) | 10-49 (small) | 50-249 (medium) | 250 & +(majors) | Total | |
| 5911 | Theatrical, video & TV production activities | 6.202 | 3.897 | 5.036 | 5.140 | 20.275 |
| 5912 | Theatrical, video & TV post-production activities | 1.782 | 662 | 280 | – | 2.724 |
| 5913 | Theatrical, video & TV distribution activities* | 381 | 239 | 922 | 284 | 1.826 |
| 5914 | Exhibition activities | 1.749 | 1.179 | 347 | 1.091 | 4.366 |
| 6020 | TV programming & broadcasting activities* | 1.067 | 2.315 | 705 | 17.915 | 22.002 |
| TOTAL AUDIOVISUAL | 11.182 | 8.291 | 7.290 | 24.430 | 51.194 |
Percentage %
| Sectors | up to 9 (micro) | 10-49 (small) | 50-249 (medium) | 250 & +(majors) | Total | |
| 5911 | Theatrical, video & TV production activities | 30,6 | 19,2 | 24,8 | 25,1 | 4100,0 |
| 5912 | Theatrical, video & TV post-production activities | 65,4 | 24,3 | 10,3 | – | 100,0 |
| 5913 | Theatrical, video & TV distribution activities* | 20,9 | 13,1 | 50,5 | 15,6 | 100,0 |
| 5914 | Exhibition activities | 40,1 | 27,0 | 7,9 | 25,0 | 100,0 |
| 6020 | TV programming & broadcasting activities* | 4,6 | 10,5 | 3,2 | 81,4 | 100,0 |
| TOTAL AUDIOVISUAL | 21,8 | 16,2 | 14,9 | 47,7 | 100,0 |
Interseasonal % 2021/2020
| Sectors | up to 9 (micro) | 10-49 (small) | 50-249 (medium) | 250 & +(majors) | Total | |
| 5911 | Theatrical, video & TV production activities | 2,8 | 24,0 | 18,2 | 176,6 | 32,5 |
| 5912 | Theatrical, video & TV post-production activities | 5,9 | 24,3 | 90,7 | -100,0 | 4,1 |
| 5913 | Theatrical, video & TV distribution activities* | -6,6 | -10,7 | 56,2 | 15,6 | 100,0 |
| 5914 | Exhibition activities | -7,9 | 5,2 | -30,0 | 8,4 | -3,5 |
| 6020 | TV programming & broadcasting activities* | -9,5 | -7,7 | 46,6 | -1,9 | -1,9 |
| TOTAL AUDIOVISUAL | -0,2 | 6,6 | 22,0 | 14,0 | 10,03 |
* All data include Rai – Radiotelevisione italiana S.p.a. and Istituto Luce-Cinecittà for equal comparison, although not classified as Public Offices and therefore not included in the Business Register.
47.7% of employees are clustered in large companies, 21.8% in micro (significantly decreasing compared to the previous season), 16.2% in small, and a growing 14.2% in medium.
In post-production, 65.4% of employees work in micro-companies, while in exhibition small companies have higher figures (27.0%). In theatrical, video & TV distribution activities, 50.5% of employees work in medium companies, while for TV programming & broadcasting activities the role of large companies is predominant (81.2%).
The growth impact of production activities translates into an increase of over 4,000 units within medium and large companies, with a major figure in relative terms in large companies (+176%). A significant increase in the employee count within medium-sized businesses was recorded in post-production (+90.7%), distribution (+56.2%), and TV programming & broadcasting (+46.6%).